TPG Results Presentation Deck
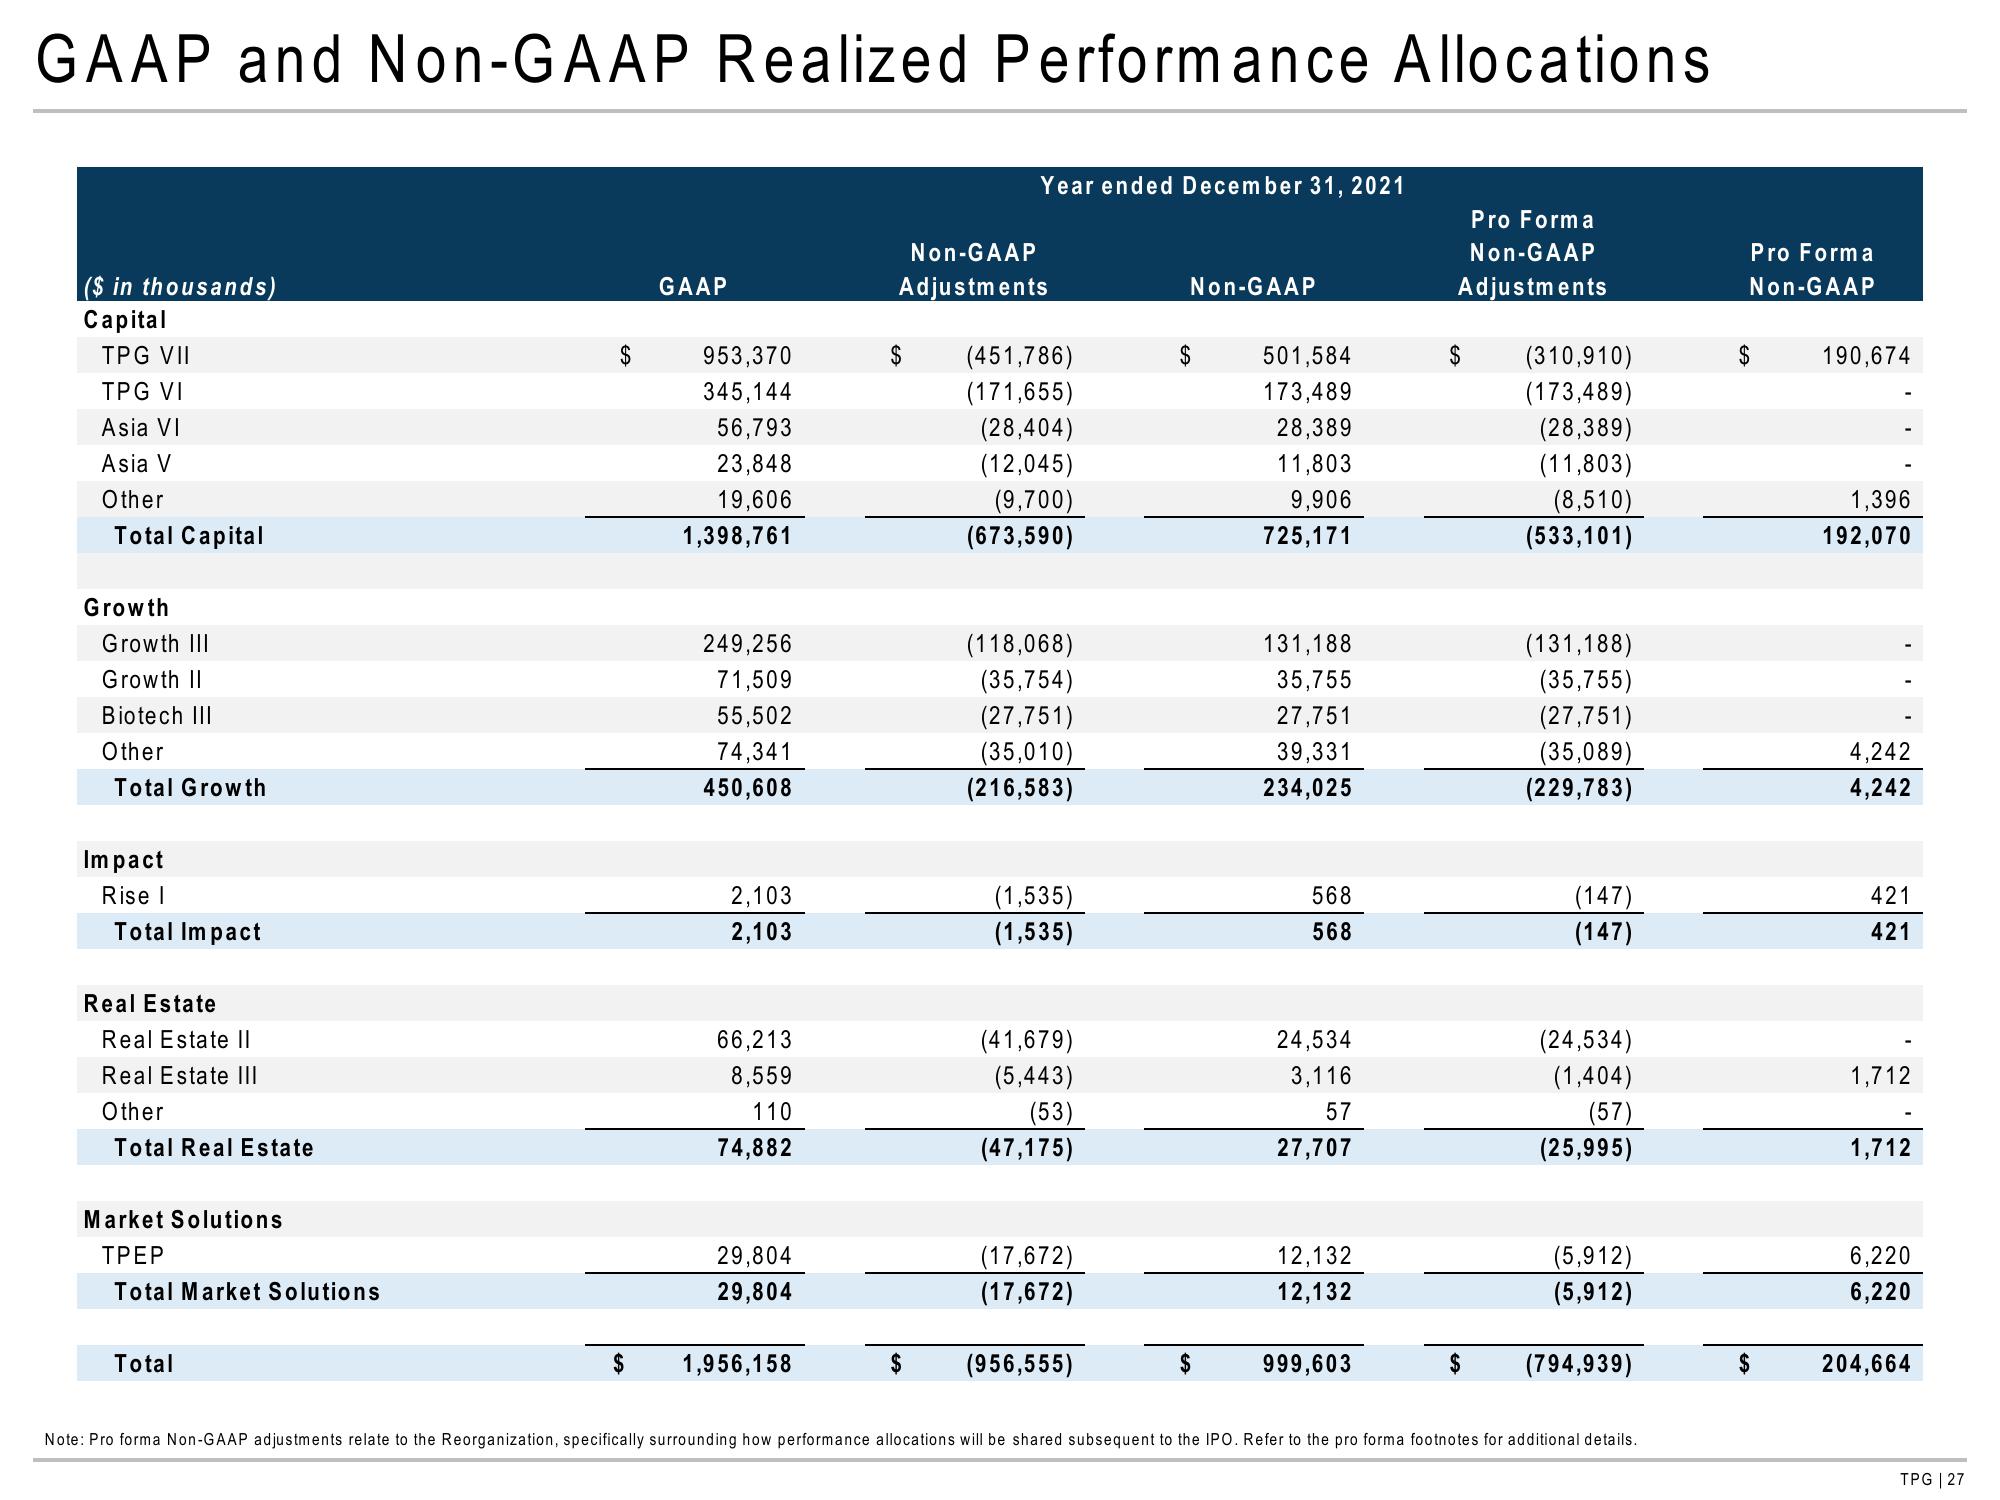
GAAP and Non-GAAP Realized Performance Allocations
($ in thousands)
Capital
TPG VII
TPG VI
Asia VI
Asia
Other
Total Capital
Growth
Growth III
Growth II
Biotech III
Other
Total Growth
Impact
Rise I
Total Impact
Real Estate
Real Estate II
Real Estate III
Other
Total Real Estate
Market Solutions
TPEP
Total Market Solutions
Total
$
$
GAAP
953,370
345,144
56,793
23,848
19,606
1,398,761
249,256
71,509
55,502
74,341
450,608
2,103
2,103
66,213
8,559
110
74,882
29,804
29,804
1,956,158
Year ended December 31, 2021
Non-GAAP
Adjustments
(451,786)
(171,655)
(28,404)
(12,045)
(9,700)
(673,590)
(118,068)
(35,754)
(27,751)
(35,010)
(216,583)
(1,535)
(1,535)
(41,679)
(5,443)
(53)
(47,175)
(17,672)
(17,672)
$ (956,555)
Non-GAAP
$
501,584
173,489
28,389
11,803
9,906
725,171
131,188
35,755
27,751
39,331
234,025
568
568
24,534
3,116
57
27,707
12,132
12,132
999,603
Pro Forma
Non-GAAP
Adjustments
$
$
(310,910)
(173,489)
(28,389)
(11,803)
(8,510)
(533,101)
(131,188)
(35,755)
(27,751)
(35,089)
(229,783)
(147)
(147)
(24,534)
(1,404)
(57)
(25,995)
(5,912)
(5,912)
(794,939)
Note: Pro forma Non-GAAP adjustments relate to the Reorganization, specifically surrounding how performance allocations will be shared subsequent to the IPO. Refer to the pro forma footnotes for additional details.
Pro Forma
Non-GAAP
$
190,674
1,396
192,070
4,242
4,242
421
421
1,712
1,712
6,220
6,220
204,664
TPG | 27View entire presentation