Uber Results Presentation Deck
Continued:
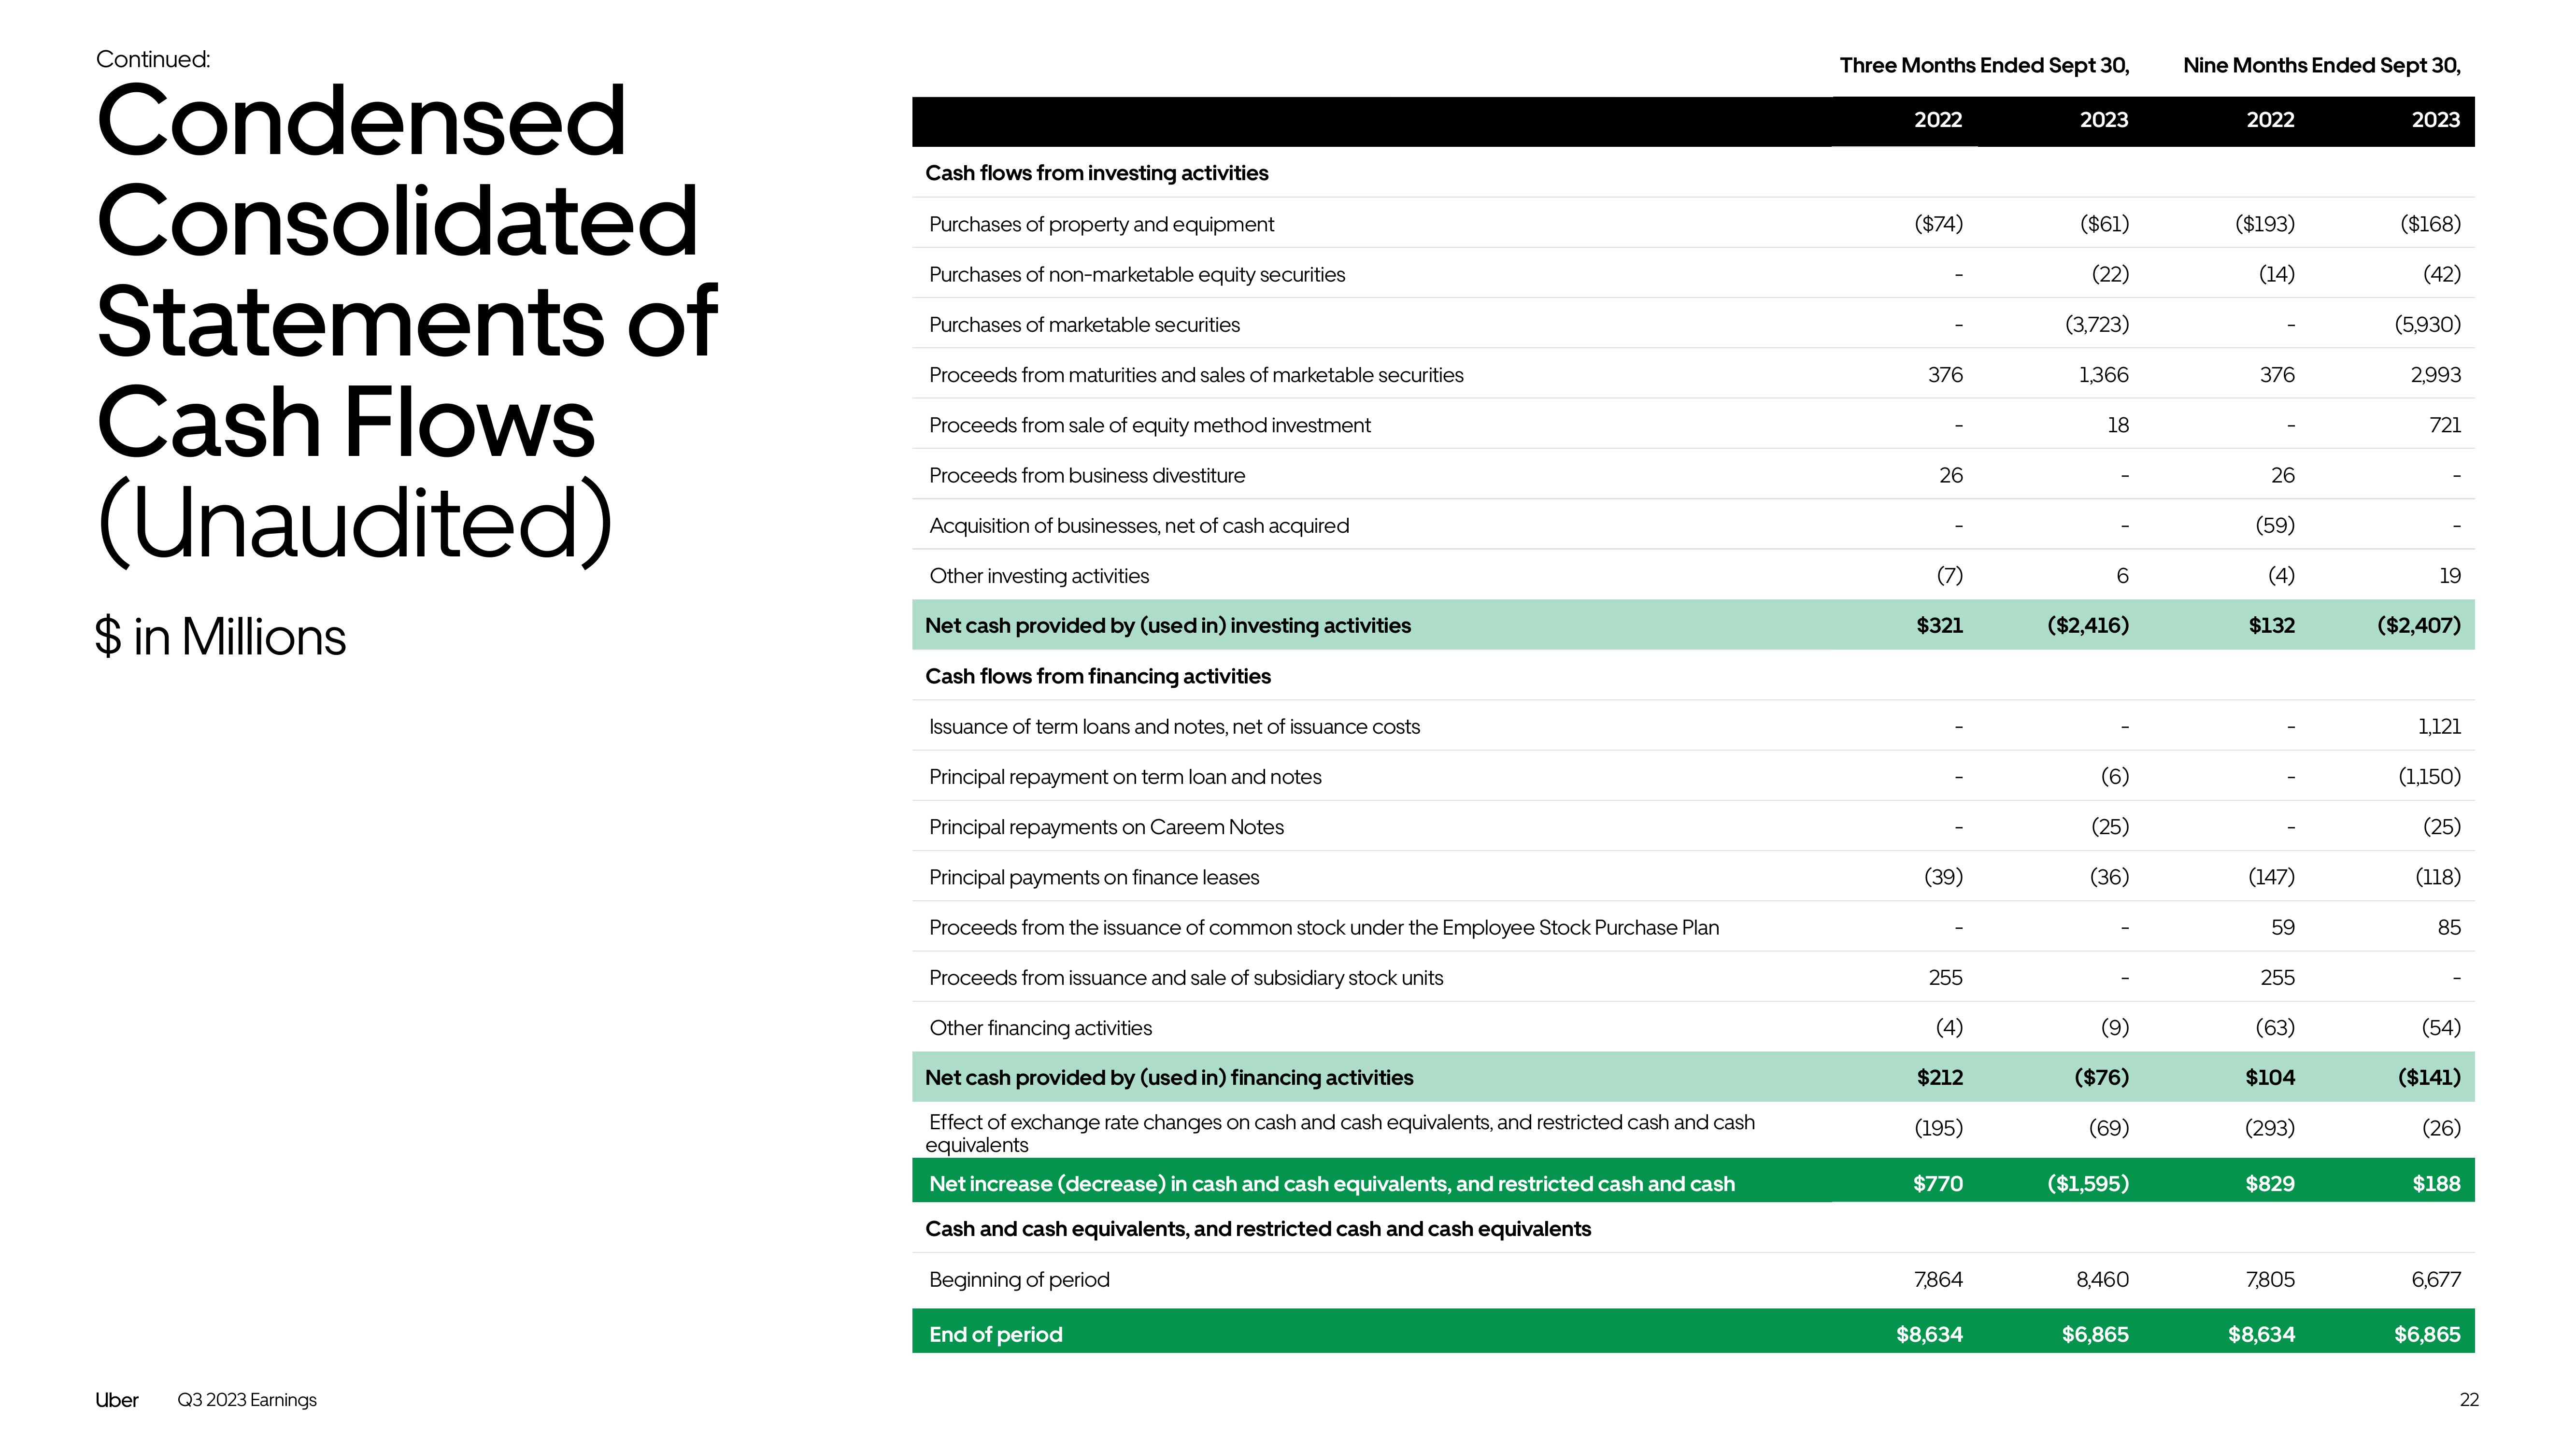
Condensed
Consolidated
Statements of
Cash Flows
(Unaudited)
$ in Millions
Uber Q3 2023 Earnings
Cash flows from investing activities
Purchases of property and equipment
Purchases of non-marketable equity securities
Purchases of marketable securities
Proceeds from maturities and sales of marketable securities
Proceeds from sale of equity method investment
Proceeds from business divestiture
Acquisition of businesses, net of cash acquired
Other investing activities
Net cash provided by (used in) investing activities
Cash flows from financing activities
Issuance of term loans and notes, net of issuance costs
Principal repayment on term loan and notes
Principal repayments on Careem Notes
Principal payments on finance leases
Proceeds from the issuance of common stock under the Employee Stock Purchase Plan
Proceeds from issuance and sale of subsidiary stock units
Other financing activities
Net cash provided by (used in) financing activities
Effect of exchange rate changes on cash and cash equivalents, and restricted cash and cash
equivalents
Net increase (decrease) in cash and cash equivalents, and restricted cash and cash
Cash and cash equivalents, and restricted cash and cash equivalents
Beginning of period
End of period
Three Months Ended Sept 30,
2022
($74)
376
26
(7)
$321
I
(39)
255
(4)
$212
(195)
$770
7,864
$8,634
2023
($61)
(22)
(3,723)
1,366
18
6
($2,416)
(6)
(25)
(36)
(9)
($76)
(69)
($1,595)
8,460
$6,865
Nine Months Ended Sept 30,
2022
($193)
(14)
376
26
(59)
(4)
$132
(147)
59
255
(63)
$104
(293)
$829
7,805
$8,634
2023
($168)
(42)
(5,930)
2,993
721
19
($2,407)
1,121
(1,150)
(25)
(118)
85
(54)
($141)
(26)
$188
6,677
$6,865
22View entire presentation