Paysafe Results Presentation Deck
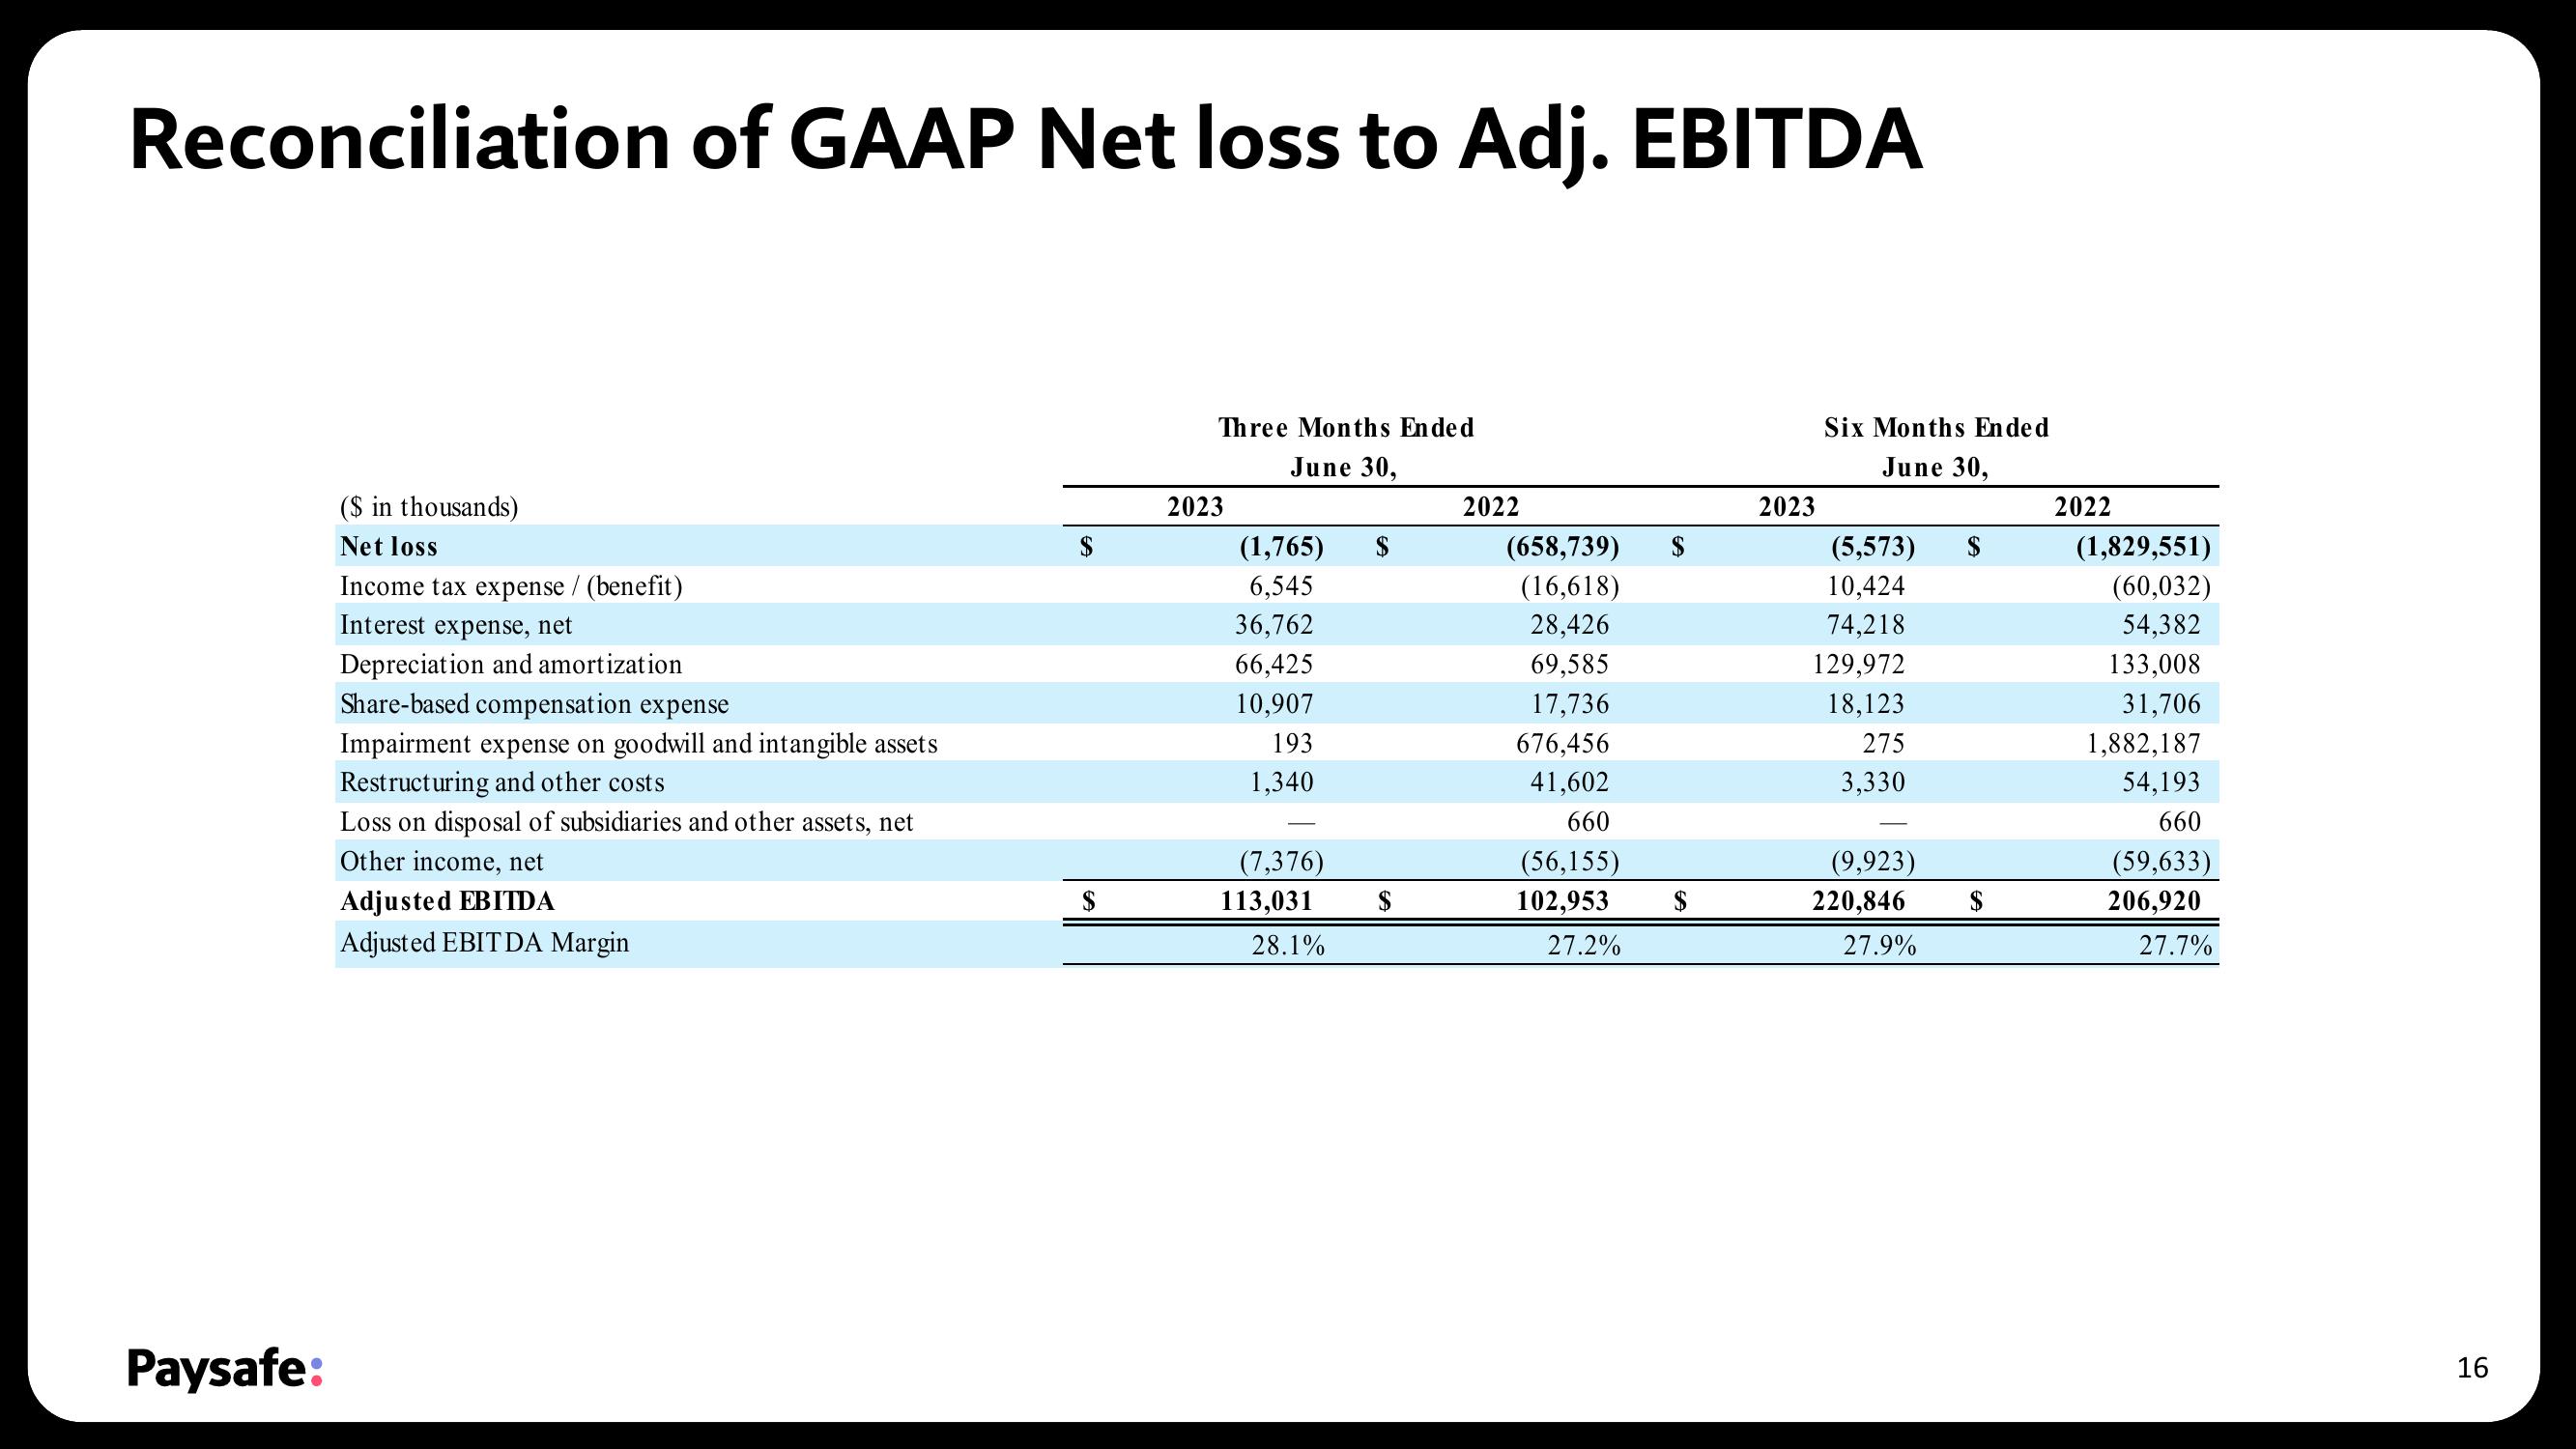
Reconciliation of GAAP Net loss to Adj. EBITDA
Paysafe:
($ in thousands)
Net loss
Income tax expense / (benefit)
Interest expense, net
Depreciation and amortization
Share-based compensation expense
Impairment expense on goodwill and intangible assets
Restructuring and other costs
Loss on disposal of subsidiaries and other assets, net
Other income, net
Adjusted EBITDA
Adjusted EBITDA Margin
$
Three Months Ended
June 30,
2023
(1,765)
6,545
36,762
66,425
10,907
193
1,340
(7,376)
113,031
28.1%
$
$
2022
(658,739)
(16,618)
28,426
69,585
17,736
676,456
41,602
660
(56,155)
102,953
27.2%
$
2023
Six Months Ended
June 30,
(5,573) $
10,424
74,218
129,972
18,123
275
3,330
(9,923)
220,846
27.9%
$
2022
(1,829,551)
(60,032)
54,382
133,008
31,706
1,882,187
54,193
660
(59,633)
206,920
27.7%
16View entire presentation