TaskUs Investor Presentation Deck
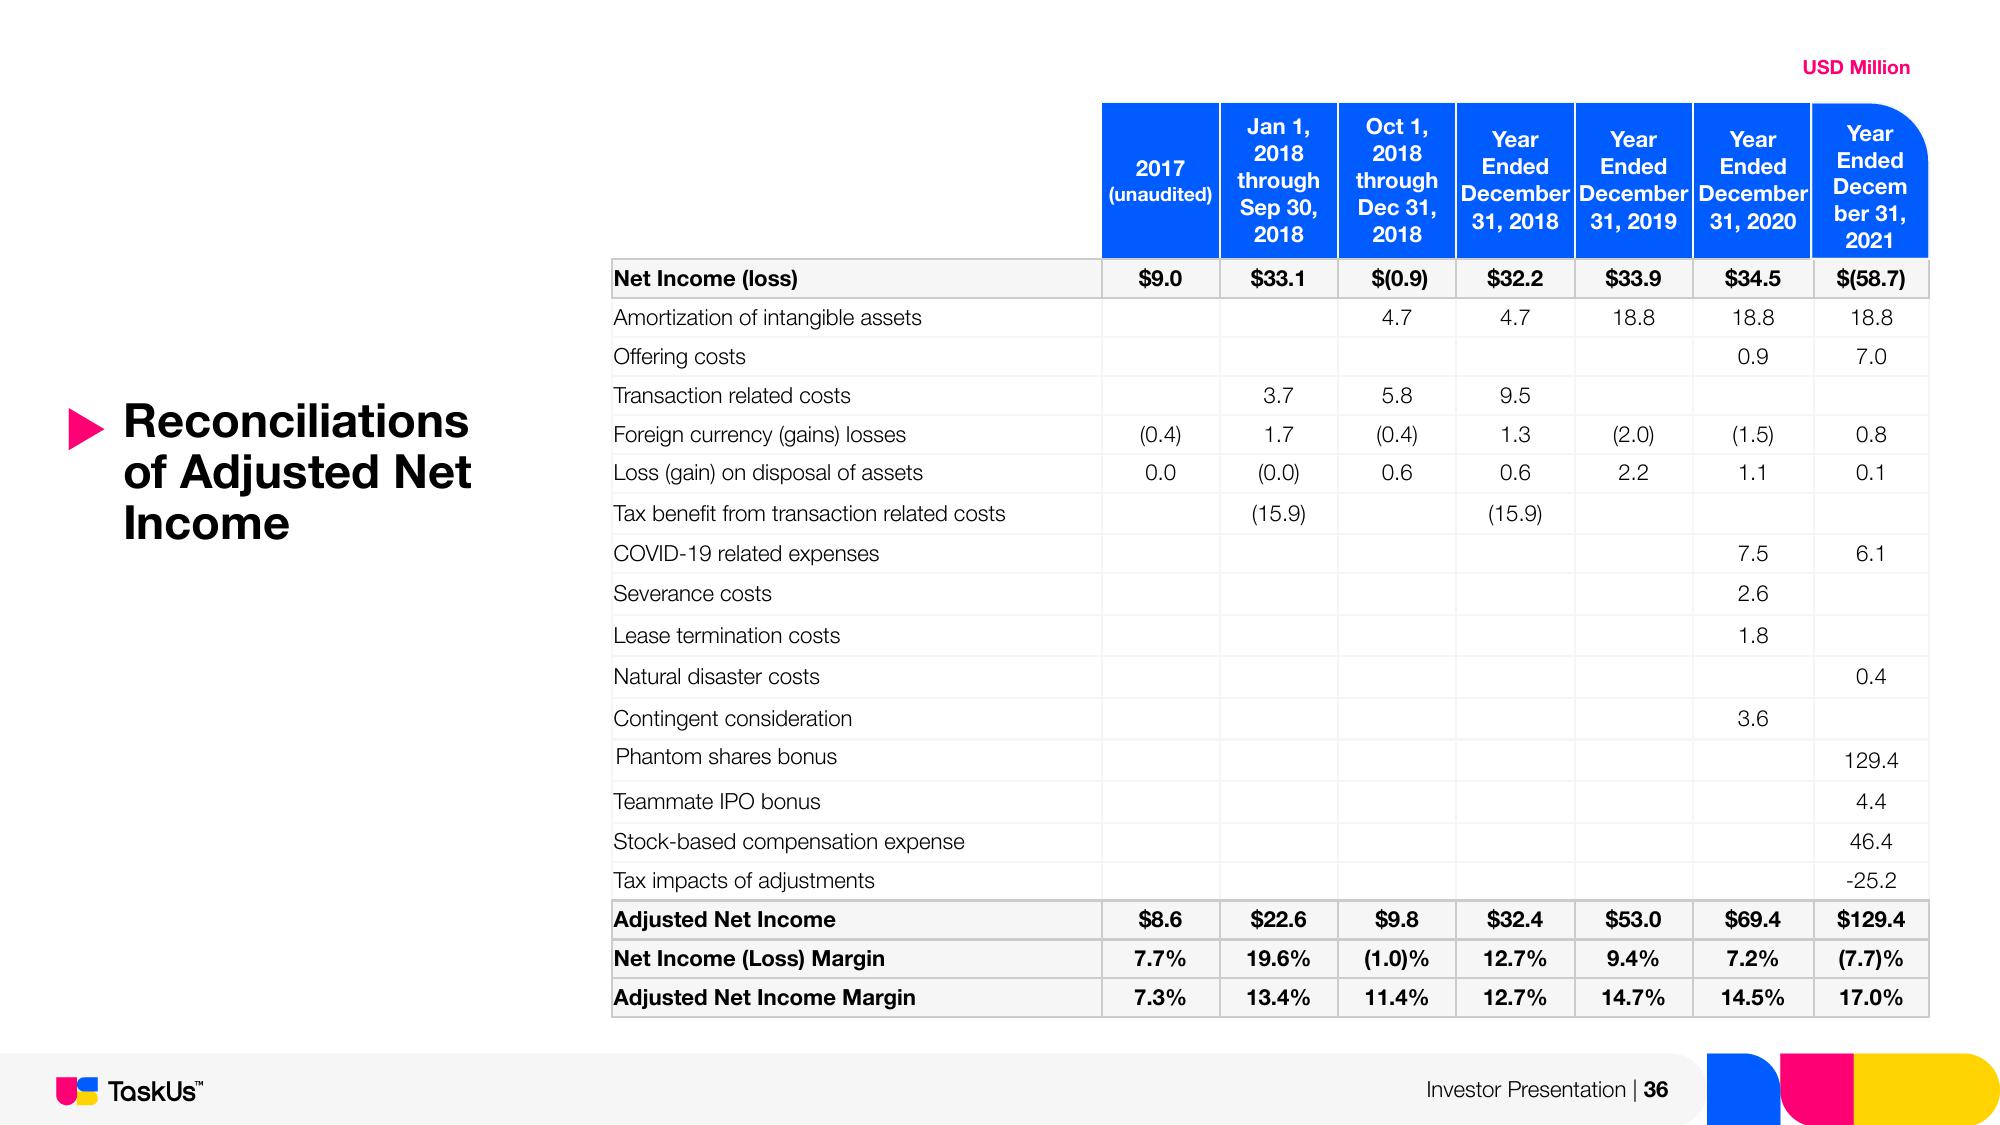
Reconciliations
of Adjusted Net
Income
TaskUs™
Net Income (loss)
Amortization of intangible assets
Offering costs
Transaction related costs
Foreign currency (gains) losses
Loss (gain) on disposal of assets
Tax benefit from transaction related costs
COVID-19 related expenses
Severance costs
Lease termination costs
Natural disaster costs
Contingent consideration
Phantom shares bonus
Teammate IPO bonus
Stock-based compensation expense
Tax impacts of adjustments
Adjusted Net Income
Net Income (Loss) Margin
Adjusted Net Income Margin
2017
(unaudited)
$9.0
(0.4)
0.0
$8.6
7.7%
7.3%
Jan 1,
2018
through
Sep 30,
2018
$33.1
3.7
1.7
(0.0)
(15.9)
$22.6
19.6%
13.4%
Oct 1,
2018
through
Dec 31,
2018
$(0.9)
4.7
5.8
(0.4)
0.6
$9.8
(1.0)%
11.4%
Year
Year
Year
Ended Ended
December December December
Ended
31, 2018
31, 2019 31, 2020
$32.2
4.7
9.5
1.3
0.6
(15.9)
$32.4
12.7%
12.7%
$33.9
18.8
(2.0)
2.2
$53.0
9.4%
14.7%
Investor Presentation | 36
$34.5
18.8
0.9
(1.5)
1.1
7.5
2.6
1.8
3.6
USD Million
$69.4
7.2%
14.5%
Year
Ended
Decem
ber 31,
2021
$(58.7)
18.8
7.0
0.8
0.1
6.1
0.4
129.4
4.4
46.4
-25.2
$129.4
(7.7)%
17.0%View entire presentation