JD Sports Results Presentation Deck
JD
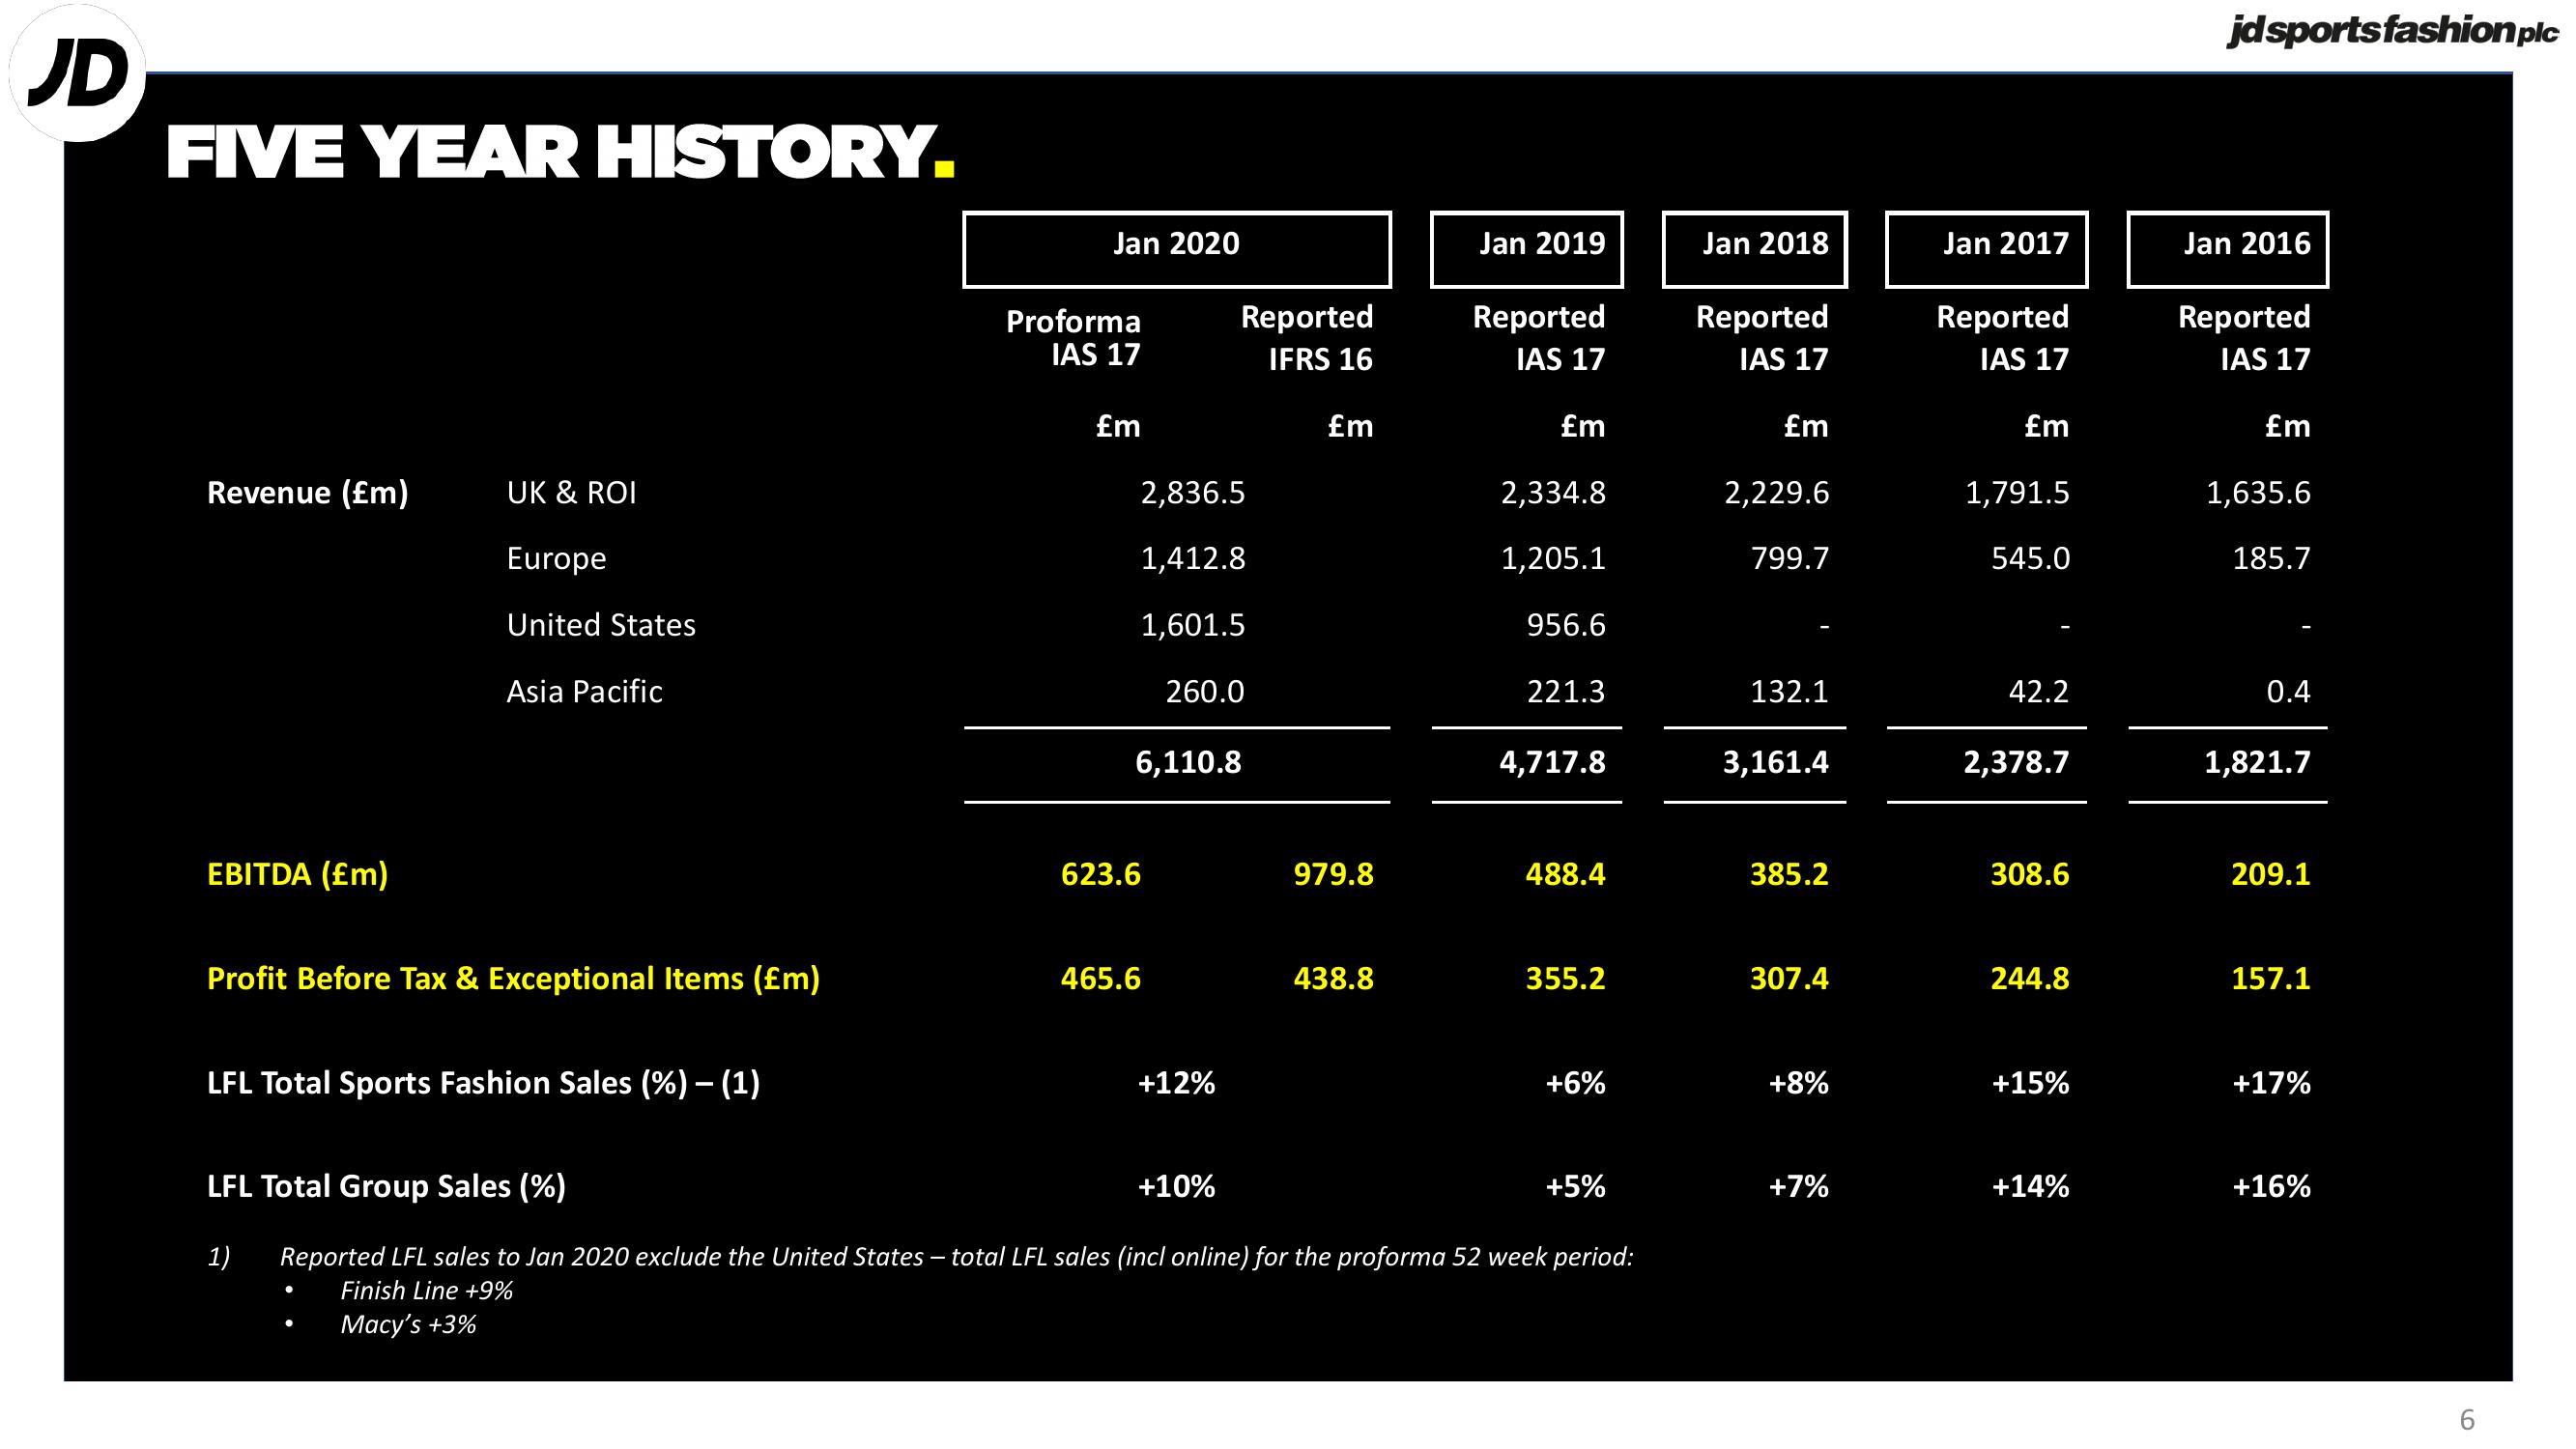
FIVE YEAR HISTORY.
Revenue (£m)
EBITDA (£m)
UK & ROI
Europe
United States
Asia Pacific
Profit Before Tax & Exceptional Items (£m)
LFL Total Sports Fashion Sales (%) – (1)
●
Jan 2020
Proforma
IAS 17
£m
2,836.5
1,412.8
1,601.5
260.0
6,110.8
623.6
465.6
Reported
IFRS 16
+12%
+10%
£m
979.8
438.8
Jan 2019
Reported
IAS 17
£m
2,334.8
1,205.1
956.6
221.3
4,717.8
488.4
355.2
LFL Total Group Sales (%)
1)
Reported LFL sales to Jan 2020 exclude the United States - total LFL sales (incl online) for the proforma 52 week period:
Finish Line +9%
Macy's +3%
+6%
+5%
Jan 2018
Reported
IAS 17
£m
2,229.6
799.7
132.1
3,161.4
385.2
307.4
+8%
+7%
Jan 2017
Reported
IAS 17
£m
1,791.5
545.0
42.2
2,378.7
308.6
244.8
+15%
+14%
jdsportsfashion plc
Jan 2016
Reported
IAS 17
£m
1,635.6
185.7
0.4
1,821.7
209.1
157.1
+17%
+16%
6View entire presentation