J.P.Morgan Results Presentation Deck
Corporate & Investment Bank1
Selected income statement data ($mm)
Revenue
Investment Banking revenue
Payments
Lending
Total Banking
Fixed Income Markets
Equity Markets
Securities Services
Credit Adjustments & Other
Total Markets & Securities Services
Expense
Credit costs
Net income²
Key drivers / statistics ($B)³
Equity
ROE
Overhead ratio
Comp/revenue
IB fees ($mm)
Average loans
Average client deposits 4
Merchant processing volume ($B)5
Assets under custody ($T)
6
ALL/EOP loans ex-conduits and trade
6
Net charge-off/(recovery) rate
Average VaR ($mm)
1 See note 1 on slide 10
2 See note 3 on slide 11
For additional footnotes see slide 12
2Q22
$11,947
1,351
1,463
410
3,224
4,711
3,079
1,151
(218)
8,723
6,745
59
$3,725
2Q22
$103.0
14%
56
29
$1,650
218.0
722.4
539.6
28.6
1.38%
0.09
$52
$ 0/(U)
1Q22
($1,582)
(706)
(391)
89
(1,008)
(987)
24
83
306
(574)
(553)
(386)
($660) ($1,295)
1Q22
$103.0
17%
54
30
2Q21
($1,267)
(2,073)
10
181
(1,882)
613
390
63
(451)
615
$2,050
212.4
709.1
490.2
31.6
1.31%
0.05
$64
222
138
2Q21
$83.0
23%
49
27
$3,572
192.5
721.9
475.2
32.1
1.53%
(0.03)
$41
LO
5
CCB
CIB
CB
AWM Corp.
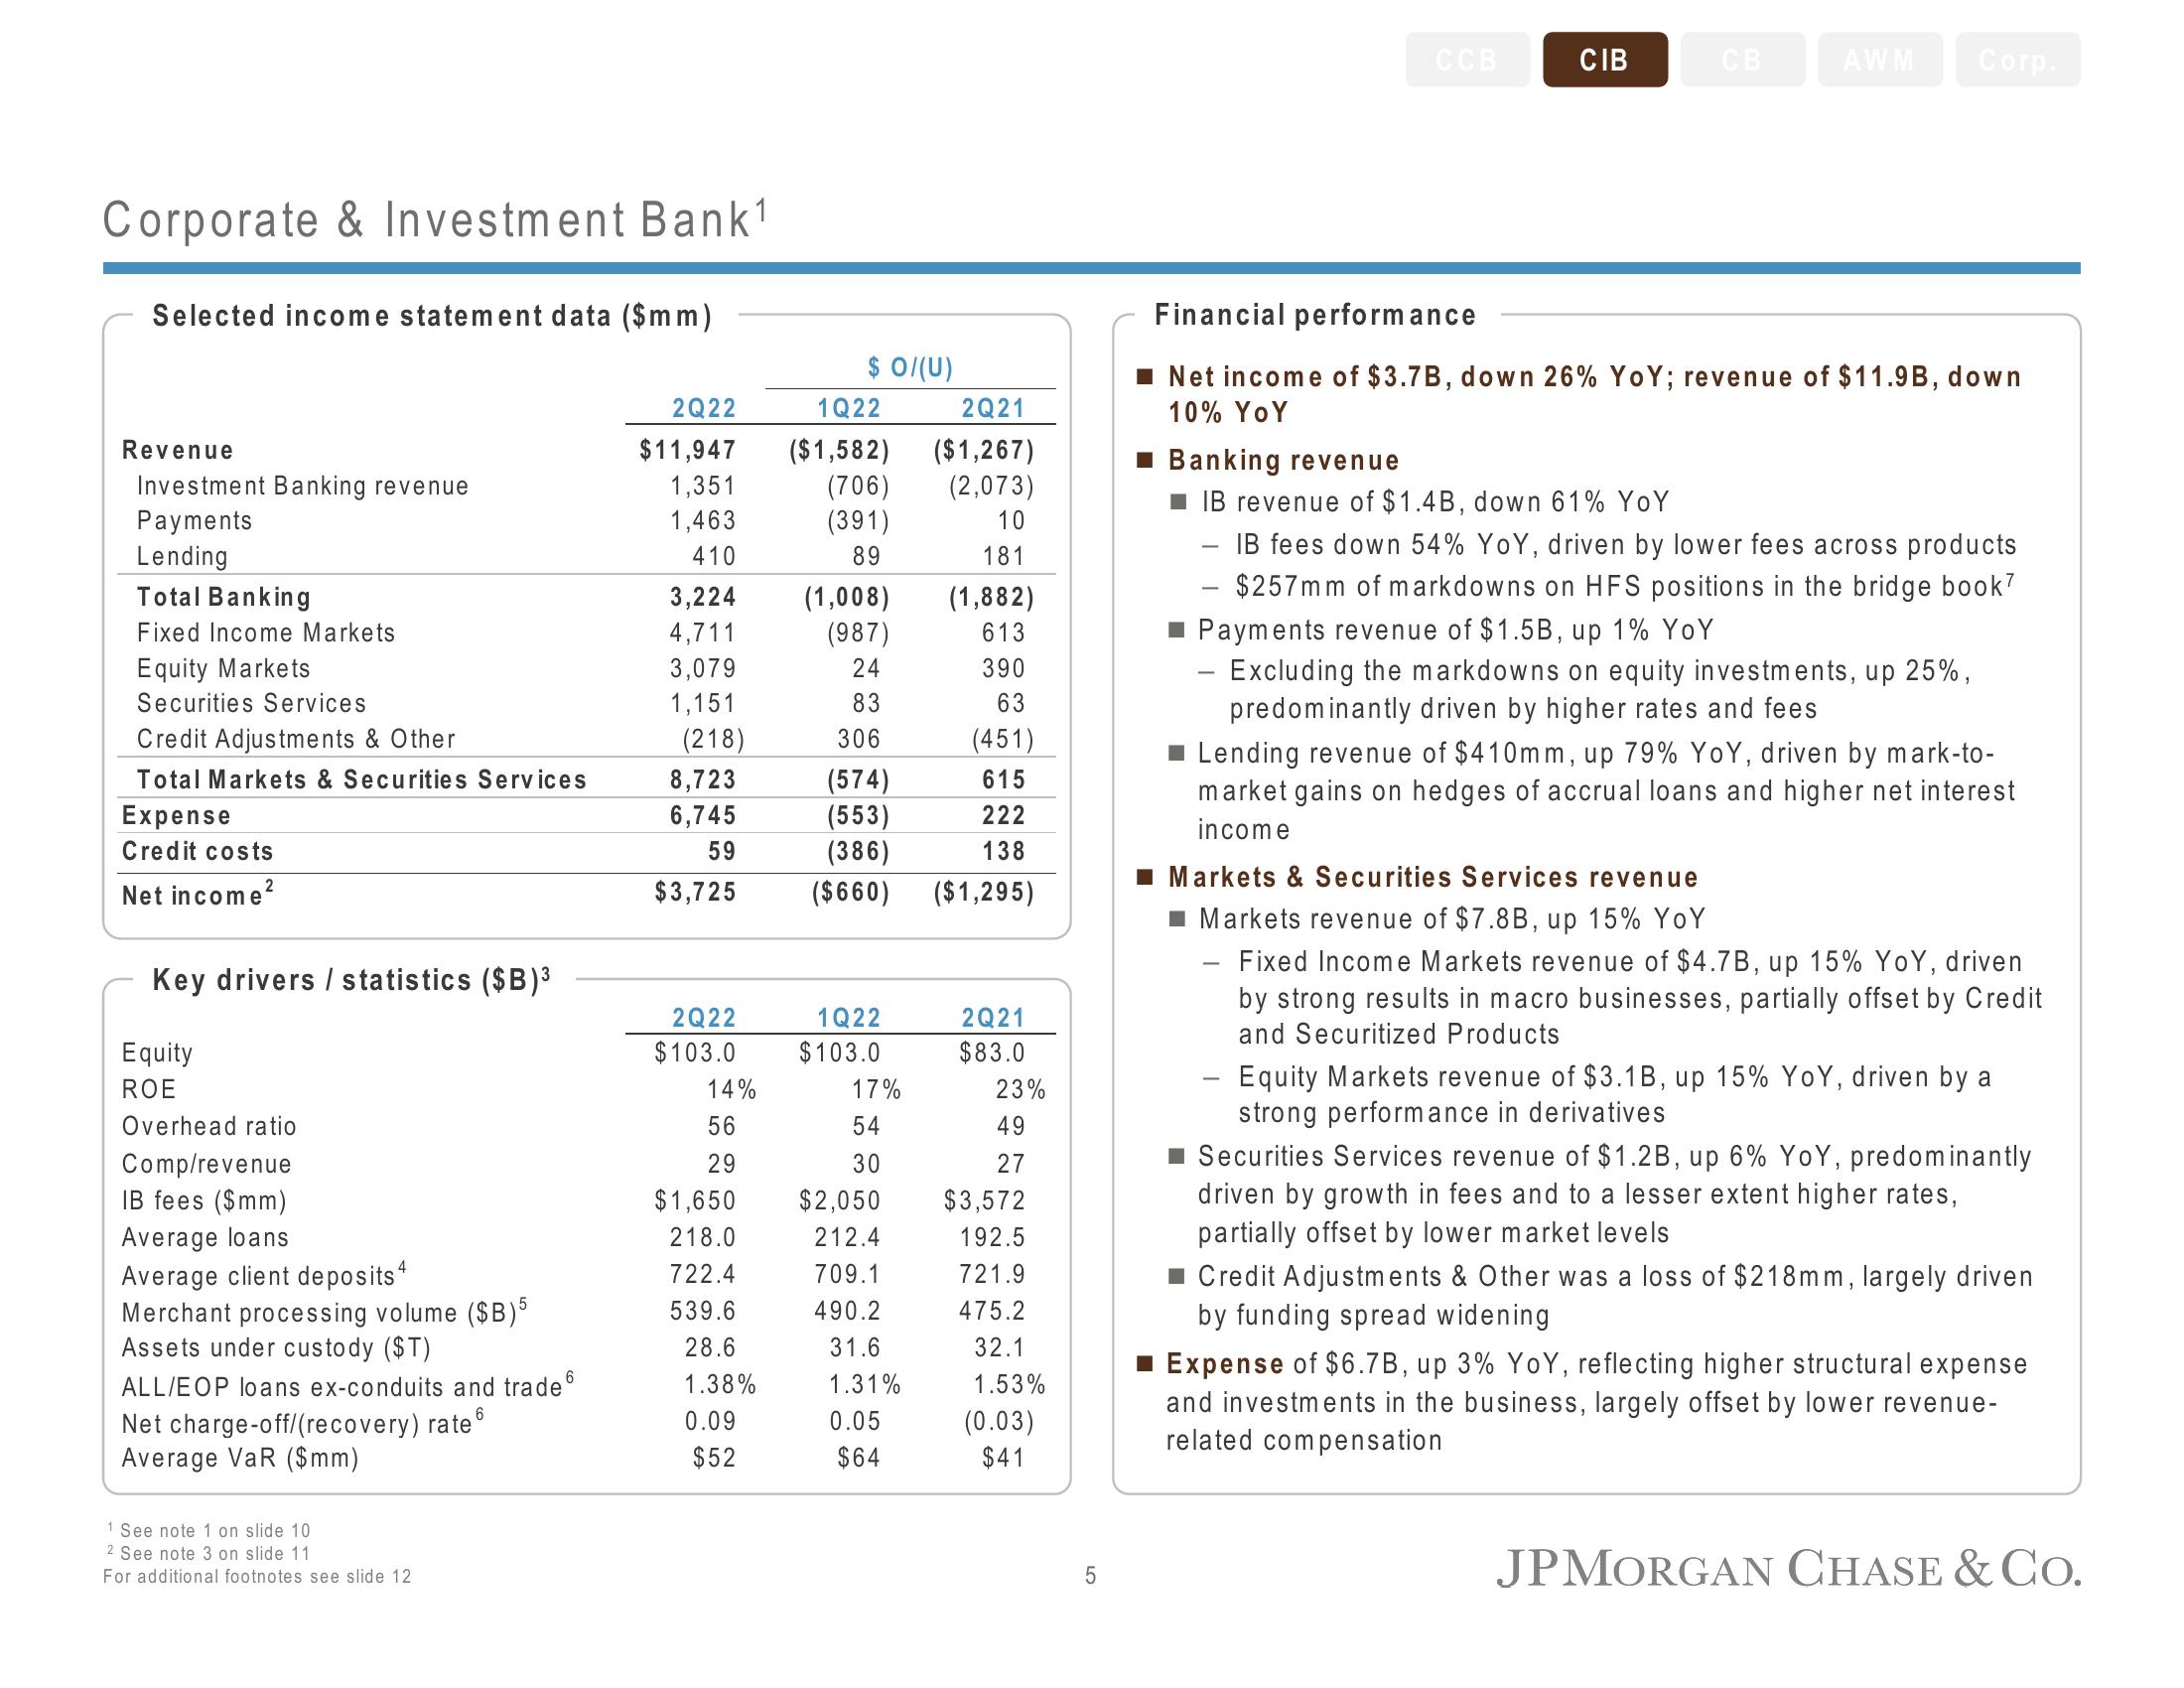
Financial performance
Net income of $3.7B, down 26% YoY; revenue of $11.9B, down
10% YoY
■ Banking revenue
■IB revenue of $1.4B, down 61% YoY
IB fees down 54% YoY, driven by lower fees across products
- $257mm of markdowns on HFS positions in the bridge book'
Payments revenue of $1.5B, up 1% YoY
Excluding the markdowns on equity investments, up 25%,
predominantly driven by higher rates and fees
■ Lending revenue of $410mm, up 79% YoY, driven by mark-to-
market gains on hedges of accrual loans and higher net interest
income
■ Markets & Securities Services revenue
■ Markets revenue of $7.8B, up 15% YoY
Fixed Income Markets revenue of $4.7B, up 15% YoY, driven
by strong results in macro businesses, partially offset by Credit
and Securitized Products
- Equity Markets revenue of $3.1B, up 15% YoY, driven by a
strong performance in derivatives
■ Securities Services revenue of $1.2B, up 6% YoY, predominantly
driven by growth in fees and to a lesser extent higher rates,
partially offset by lower market levels
■ Credit Adjustments & Other was a loss of $218mm, largely driven
by funding spread widening
Expense of $6.7B, up 3% YoY, reflecting higher structural expense
and investments in the business, largely offset by lower revenue-
related compensation
JPMORGAN CHASE & Co.View entire presentation