Allwyn Results Presentation Deck
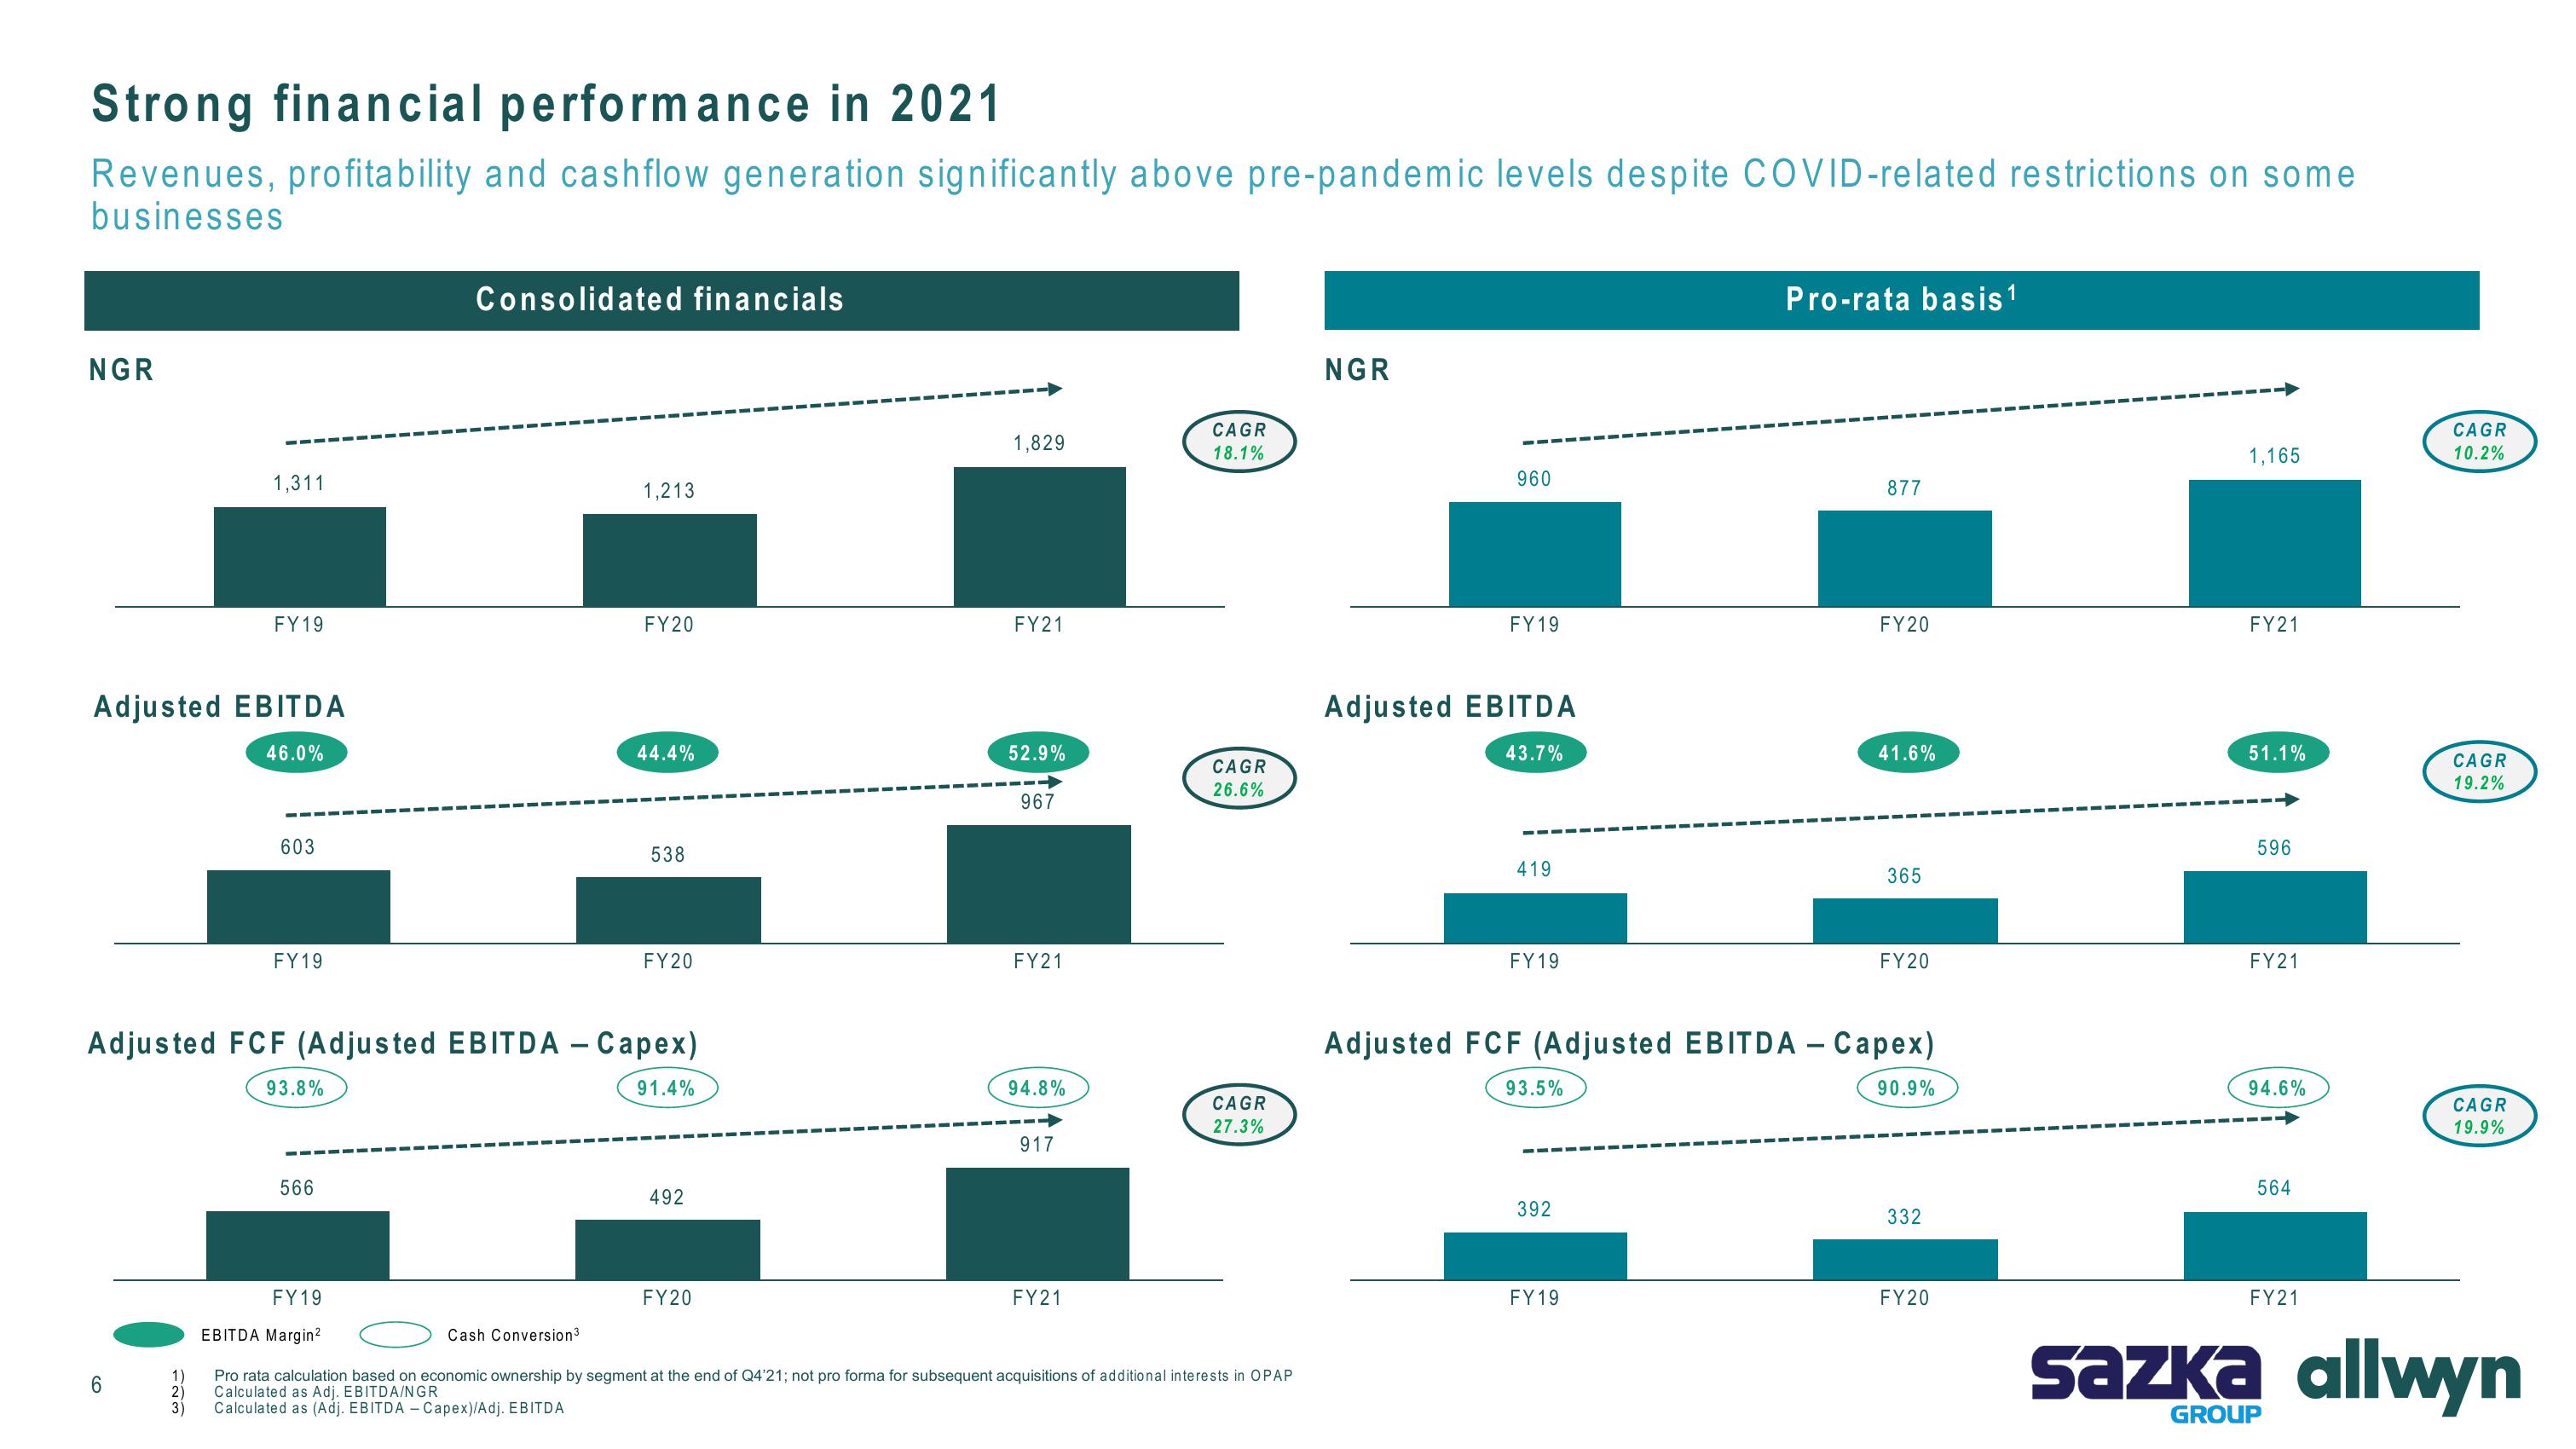
Strong financial performance in 2021
Revenues, profitability and cashflow generation significantly above pre-pandemic levels despite COVID-related restrictions on some
businesses
NGR
1,311
Adjusted EBITDA
46.0%
6
FY 19
1)
2)
3)
603
FY19
93.8%
566
Consolidated financials
FY19
EBITDA Margin²
Adjusted FCF (Adjusted EBITDA - Capex)
91.4%
1,213
Cash Conversion³
FY20
44.4%
538
FY20
492
FY20
1,829
FY21
52.9%
967
FY21
94.8%
917
FY21
CAGR
18.1%
CAGR
26.6%
CAGR
27.3%
Pro rata calculation based on economic ownership by segment at the end of Q4'21; not pro forma for subsequent acquisitions of additional interests in OPAP
Calculated as Adj. EBITDA/NGR
Calculated as (Adj. EBITDA - Capex)/Adj. EBITDA
NGR
960
FY19
Adjusted EBITDA
43.7%
419
FY19
93.5%
392
Pro-rata basis ¹
FY 19
877
FY20
41.6%
Adjusted FCF (Adjusted EBITDA - Capex)
90.9%
365
FY20
332
FY20
1,165
FY21
51.1%
596
FY21
94.6%
564
FY21
CAGR
10.2%
GROUP
CAGR
19.2%
CAGR
19.9%
sazka allwynView entire presentation