Silicon Valley Bank Results Presentation Deck
Outstanding performance and real estate charges drive Q4'20 expenses
higher than guidance
Expect FY'21 expense % growth in the low single digits
●
●
Q4'20 activity
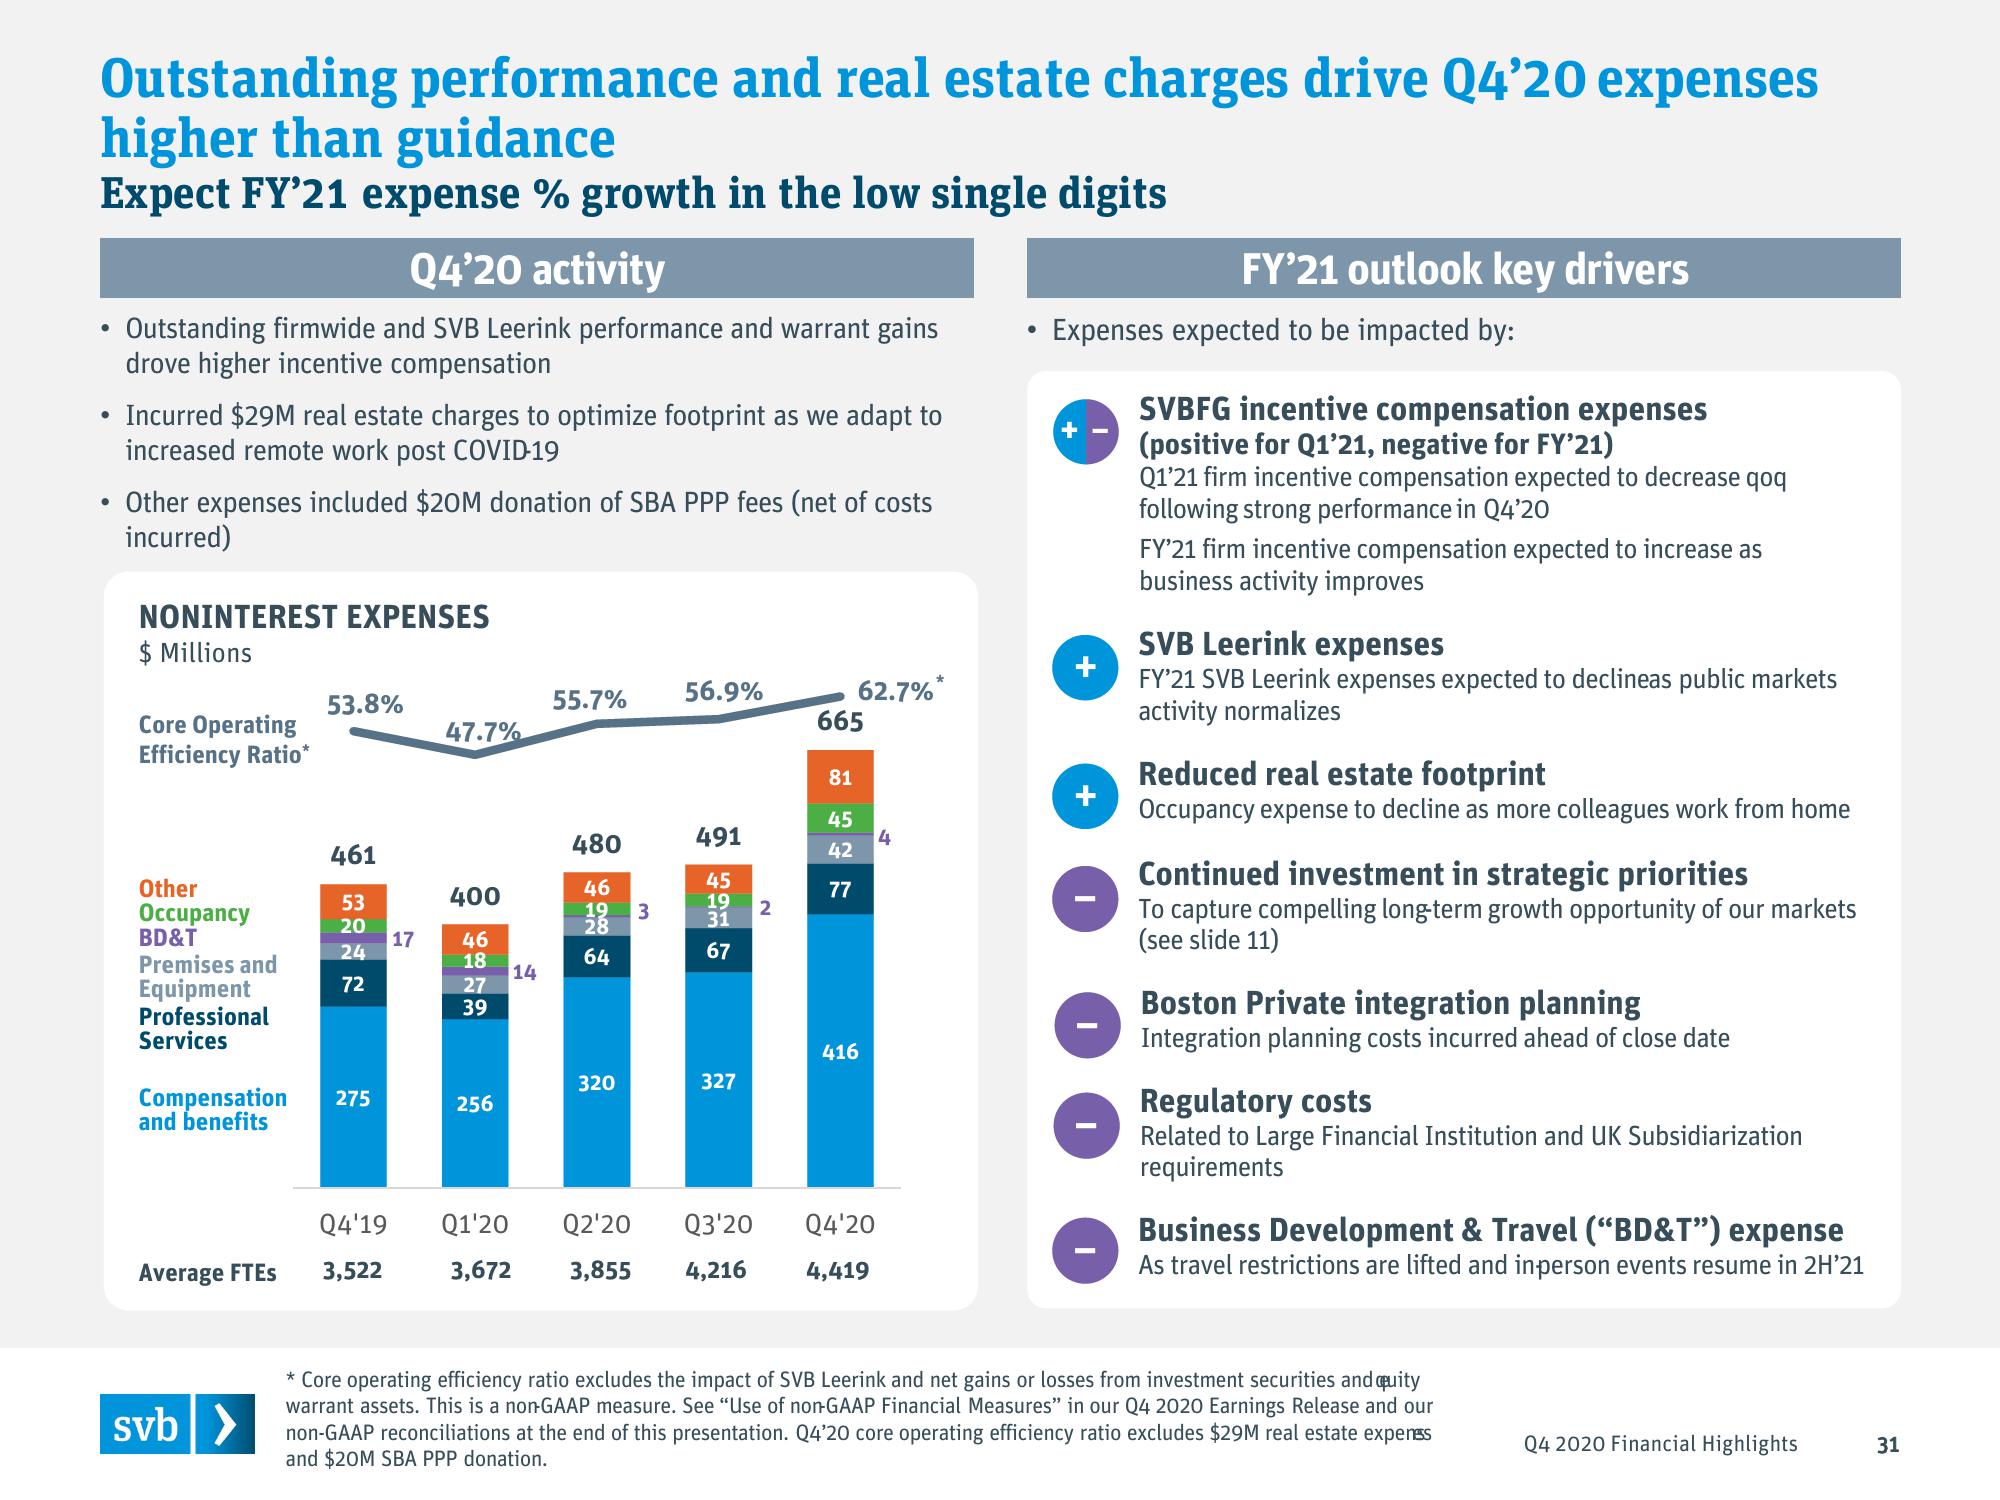
Outstanding firmwide and SVB Leerink performance and warrant gains
drove higher incentive compensation
Incurred $29M real estate charges to optimize footprint as we adapt to
increased remote work post COVID-19
Other expenses included $20M donation of SBA PPP fees (net of costs
incurred)
NONINTEREST EXPENSES
$ Millions
Core Operating
Efficiency Ratio*
Other
Occupancy
BD&T
Premises and
Equipment
Professional
Services
Compensation
and benefits
Average FTES
svb >
53.8%
461
53
20
24
72
275
Q4'19
3,522
17
47.7%
400
46
18
27
39
256
Q1'20
3,672
14
55.7%
480
46
19 3
28
64
320
56.9%
491
45
19
31
67
327
2
Q2'20
3,855 4,216
62.7%*
665
81
45
42
77
416
Q3'20 Q4'20
4,419
4
Expenses expected to be impacted by:
+
+
FY'21 outlook key drivers
I
SVBFG incentive compensation expenses
(positive for Q1'21, negative for FY'21)
Q1'21 firm incentive compensation expected to decrease qoq
following strong performance in Q4'20
FY'21 firm incentive compensation expected to increase as
business activity improves
SVB Leerink expenses
FY'21 SVB Leerink expenses expected to declineas public markets
activity normalizes
Reduced real estate footprint
Occupancy expense to decline as more colleagues work from home
Continued investment in strategic priorities
To capture compelling long-term growth opportunity of our markets
(see slide 11)
Boston Private integration planning
Integration planning costs incurred ahead of close date
Regulatory costs
Related to Large Financial Institution and UK Subsidiarization
requirements
Business Development & Travel ("BD&T") expense
As travel restrictions are lifted and in-person events resume in 2H'21
* Core operating efficiency ratio excludes the impact of SVB Leerink and net gains or losses from investment securities and quity
warrant assets. This is a non-GAAP measure. See "Use of non-GAAP Financial Measures" in our Q4 2020 Earnings Release and our
non-GAAP reconciliations at the end of this presentation. Q4'20 core operating efficiency ratio excludes $29M real estate expenss
and $20M SBA PPP donation.
Q4 2020 Financial Highlights
31View entire presentation