Evercore Investment Banking Pitch Book
Sensitivity Case #2 - Illustrative Unit 8 Expansion Economics
2 Illustrative Unit 8 Expansion Economics
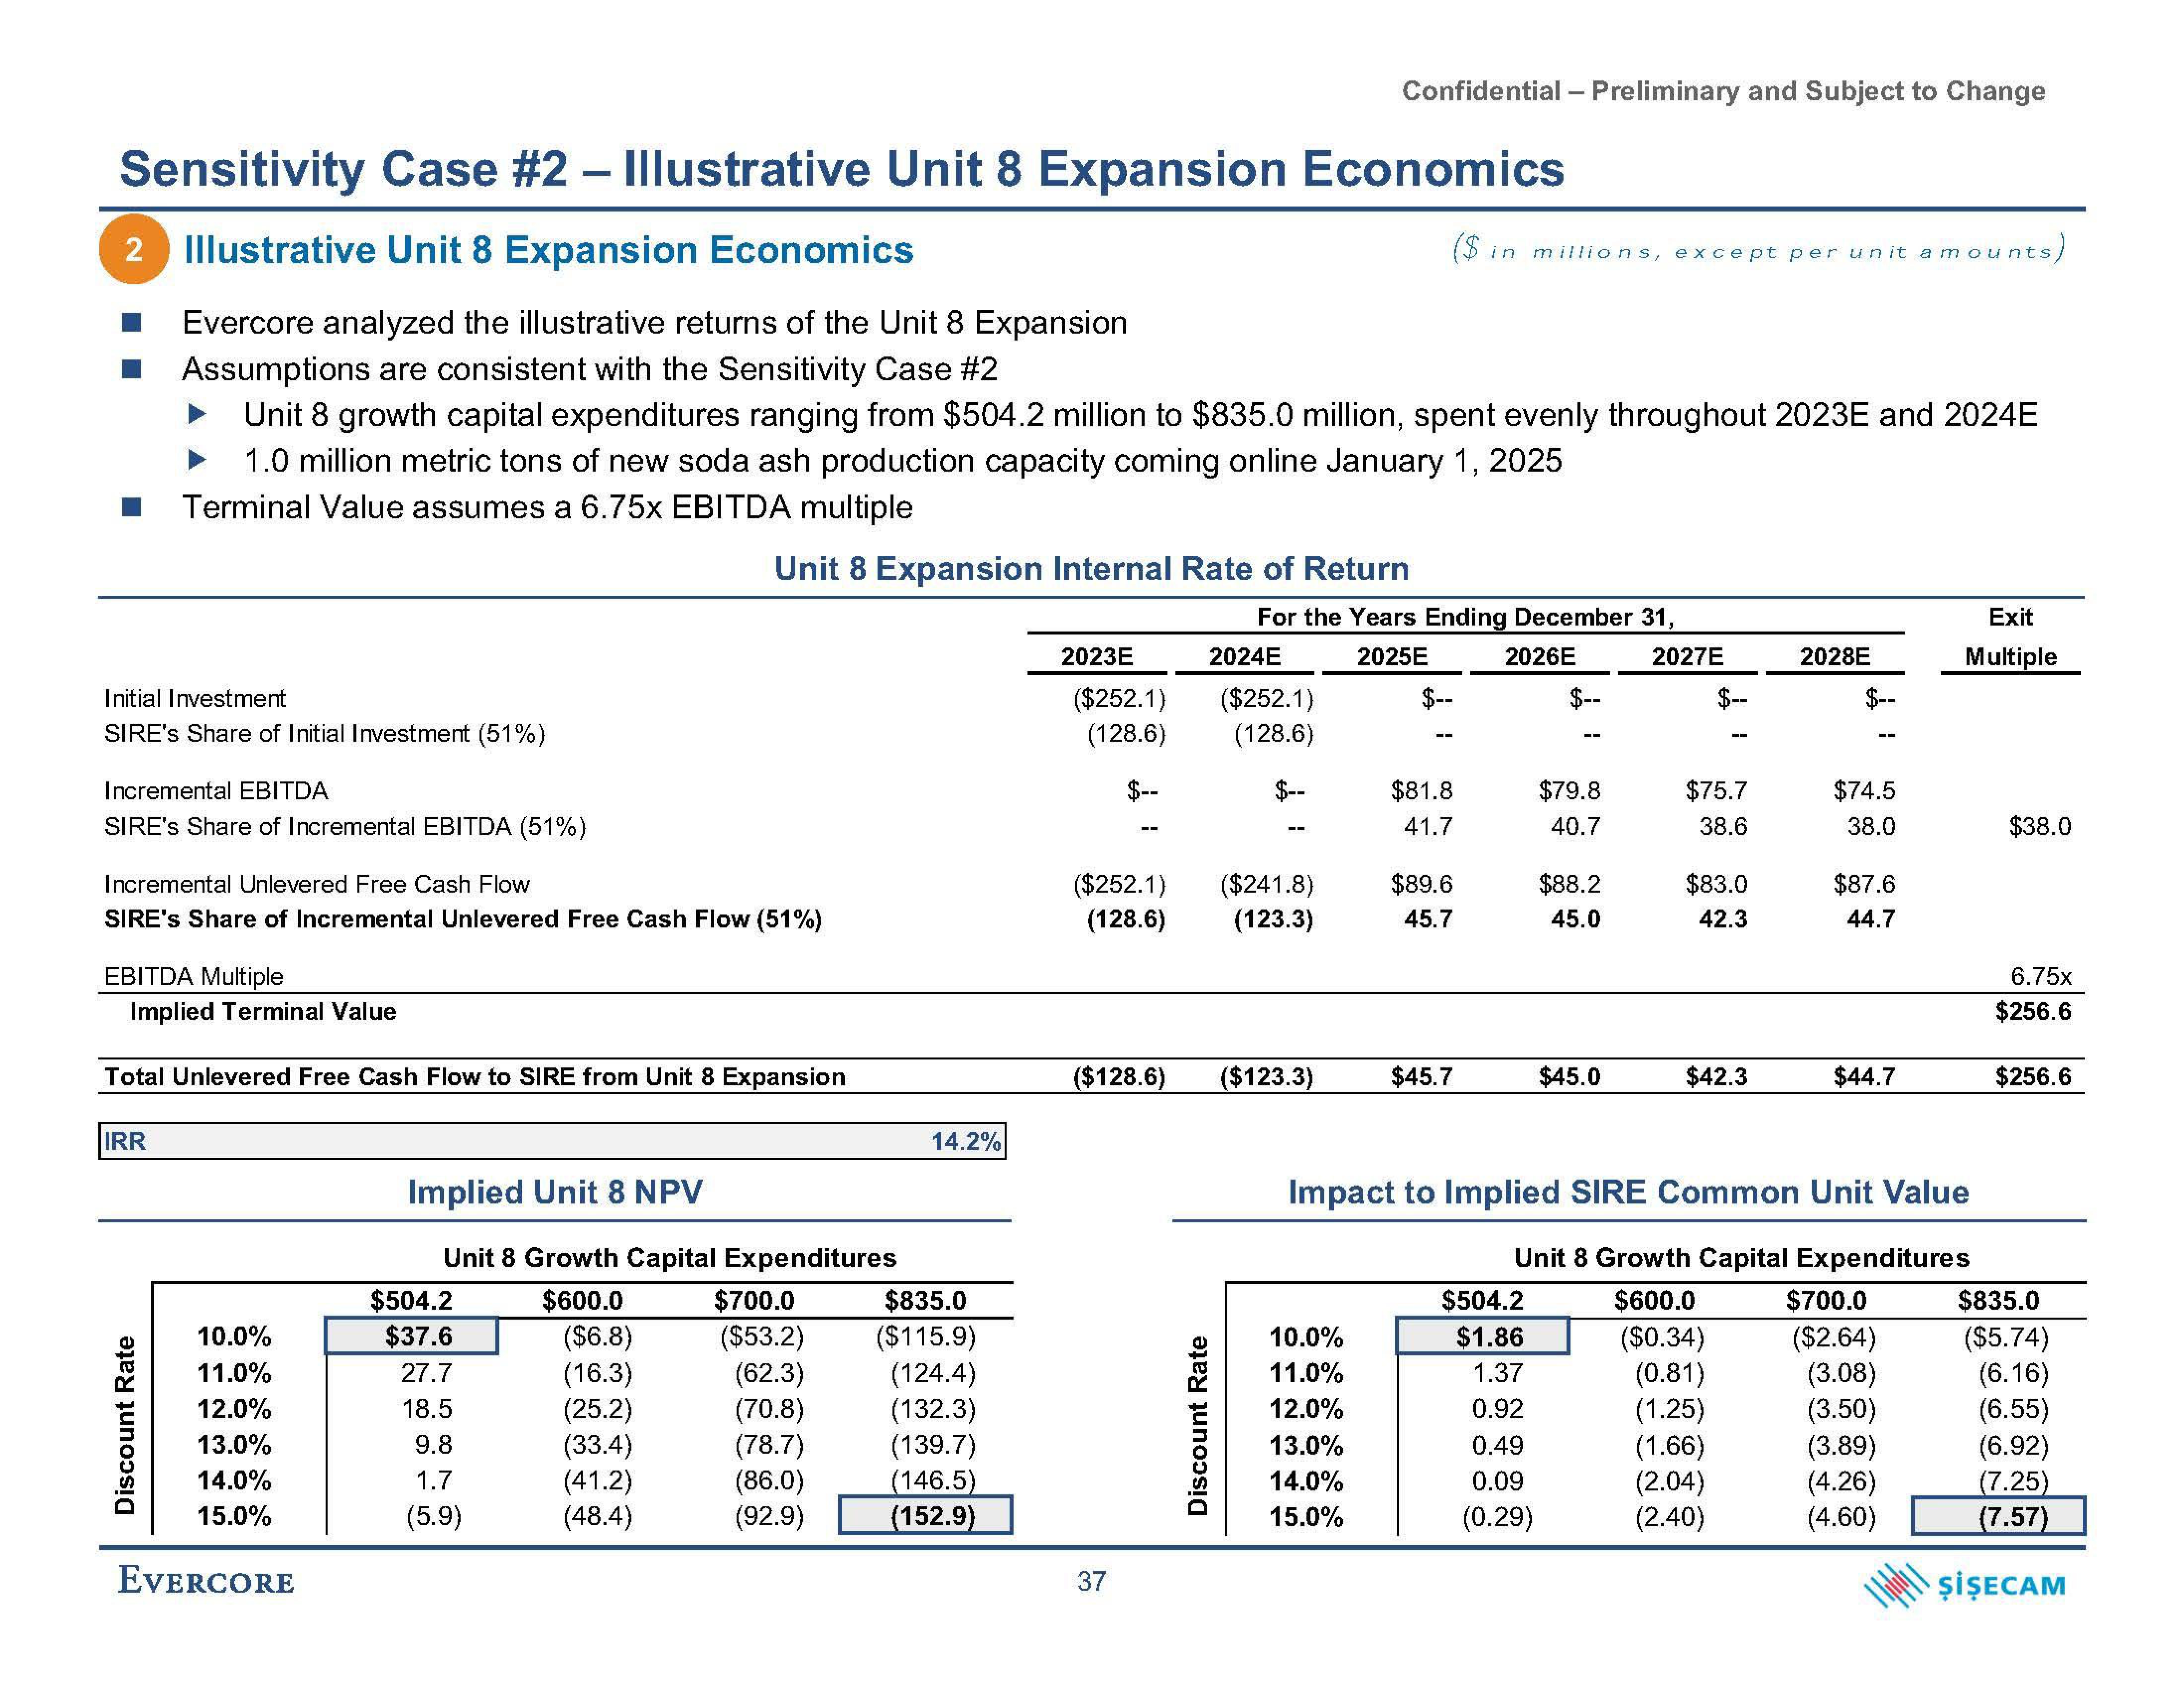
Evercore analyzed the illustrative returns of the Unit 8 Expansion
Assumptions are consistent with the Sensitivity Case #2
Unit 8 growth capital expenditures ranging from $504.2 million to $835.0 million, spent evenly throughout 2023E and 2024E
1.0 million metric tons of new soda ash production capacity coming online January 1, 2025
Terminal Value assumes a 6.75x EBITDA multiple
Initial Investment
SIRE's Share of Initial Investment (51%)
Incremental EBITDA
SIRE's Share of Incremental EBITDA (51%)
Incremental Unlevered Free Cash Flow
SIRE's Share of Incremental Unlevered Free Cash Flow (51%)
EBITDA Multiple
Implied Terminal Value
Total Unlevered Free Cash Flow to SIRE from Unit 8 Expansion
IRR
Discount Rate
10.0%
11.0%
12.0%
13.0%
14.0%
15.0%
EVERCORE
Implied Unit 8 NPV
Unit 8 Growth Capital Expenditures
$600.0
$504.2
$37.6
27.7
18.5
9.8
Unit 8 Expansion Internal Rate of Return
1.7
(5.9)
($6.8)
(16.3)
(25.2)
(33.4)
(41.2)
(48.4)
$700.0
($53.2)
(62.3)
(70.8)
(78.7)
(86.0)
(92.9)
14.2%
$835.0
($115.9)
(124.4)
(132.3)
(139.7)
(146.5)
(152.9)
2023E
($252.1)
(128.6)
($252.1)
(128.6)
($128.6)
37
Discount Rate
2024E
($252.1)
(128.6)
$--
Confidential - Preliminary and Subject to Change
For the Years Ending December 31,
2025E
2026E
$--
($241.8)
(123.3)
($123.3)
($ in millions, except per unit amounts,
10.0%
11.0%
12.0%
13.0%
14.0%
15.0%
$81.8
41.7
$89.6
45.7
$45.7
$79.8
40.7
$504.2
$1.86
1.37
0.92
0.49
0.09
(0.29)
$88.2
45.0
$45.0
2027E
$75.7
38.6
$83.0
42.3
$42.3
2028E
$74.5
38.0
$87.6
44.7
$44.7
Impact to Implied SIRE Common Unit Value
Unit 8 Growth Capital Expenditures
$600.0
($0.34)
(0.81)
(1.25)
(1.66)
(2.04)
(2.40)
Exit
Multiple
$700.0
($2.64)
(3.08)
(3.50)
(3.89)
(4.26)
(4.60)
$38.0
6.75x
$256.6
$256.6
$835.0
($5.74)
(6.16)
(6.55)
(6.92)
(7.25)
(7.57)
ŞİŞECAMView entire presentation