Cboe Results Presentation Deck
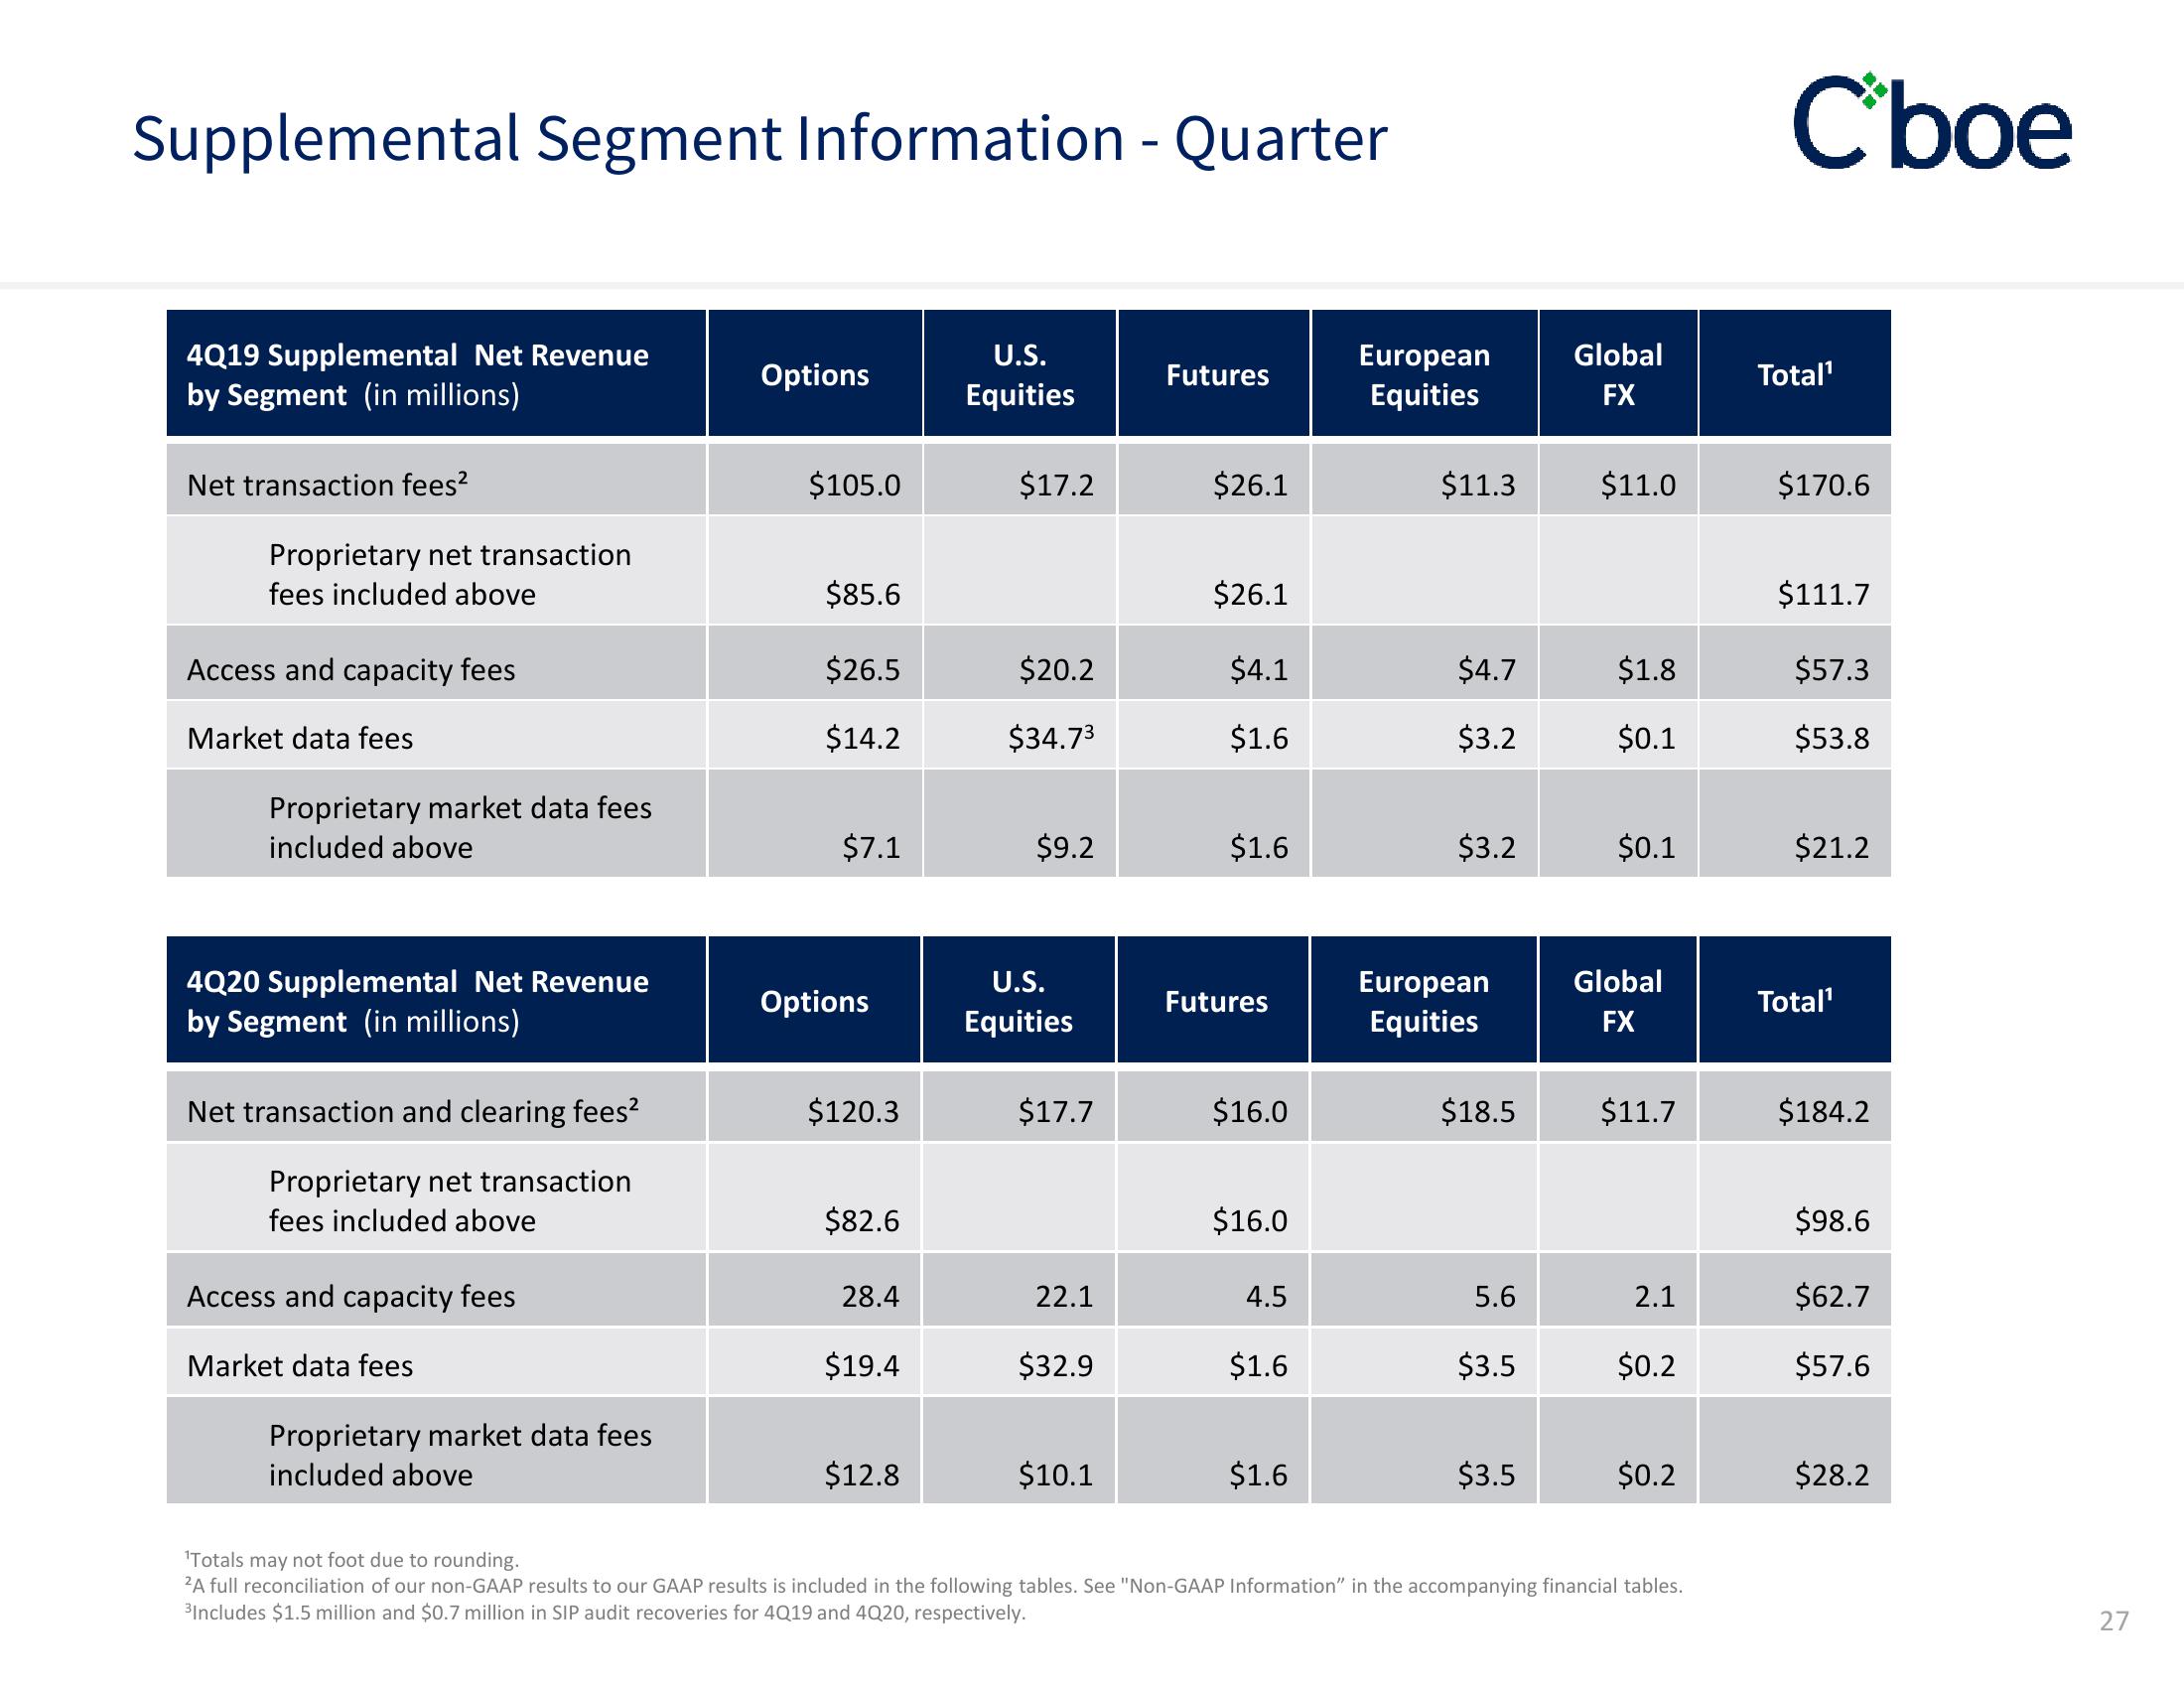
Supplemental Segment Information - Quarter
4Q19 Supplemental Net Revenue
by Segment (in millions)
Net transaction fees²
Proprietary net transaction
fees included above
Access and capacity fees
Market data fees
Proprietary market data fees
included above
4Q20 Supplemental Net Revenue
by Segment (in millions)
Net transaction and clearing fees²
Proprietary net transaction
fees included above
Access and capacity fees
Market data fees
Proprietary market data fees
included above
Options
$105.0
$85.6
$26.5
$14.2
$7.1
Options
$120.3
$82.6
28.4
$19.4
$12.8
U.S.
Equities
$17.2
$20.2
$34.73
$9.2
U.S.
Equities
$17.7
22.1
$32.9
$10.1
Futures
$26.1
$26.1
$4.1
$1.6
$1.6
Futures
$16.0
$16.0
4.5
$1.6
$1.6
European
Equities
$11.3
$4.7
$3.2
$3.2
European
Equities
$18.5
5.6
$3.5
$3.5
Global
FX
$11.0
$1.8
$0.1
$0.1
Global
FX
$11.7
2.1
$0.2
$0.2
¹Totals may not foot due to rounding.
2A full reconciliation of our non-GAAP results to our GAAP results is included in the following tables. See "Non-GAAP Information" in the accompanying financial tables.
³Includes $1.5 million and $0.7 million in SIP audit recoveries for 4Q19 and 4Q20, respectively.
Cboe
Total¹
$170.6
$111.7
$57.3
$53.8
$21.2
Total¹
$184.2
$98.6
$62.7
$57.6
$28.2
27View entire presentation