Kinnevik Results Presentation Deck
Intro
Net Asset Value
MULTIPLE CONTRACTION
We continue to seek to reflect the quarter-end valuation levels of publicly
listed peers when valuing our unlisted businesses, typically allowing
peer group multiple contraction to flow through our valuations without
adjustment. We increasingly focus on multiples of expected revenue
over the next twelve months ("NTM") to deemphasize the direct weight
of importance placed on more longer-term projections. A focus on NTM
forecasts when reflecting changes in multiples of listed peers means that
the valuations of some of our companies demonstrating high growth and
low cash burn are more resilient than that of the average listed peer, and
more in line with the stronger constituents of the respective peer group.
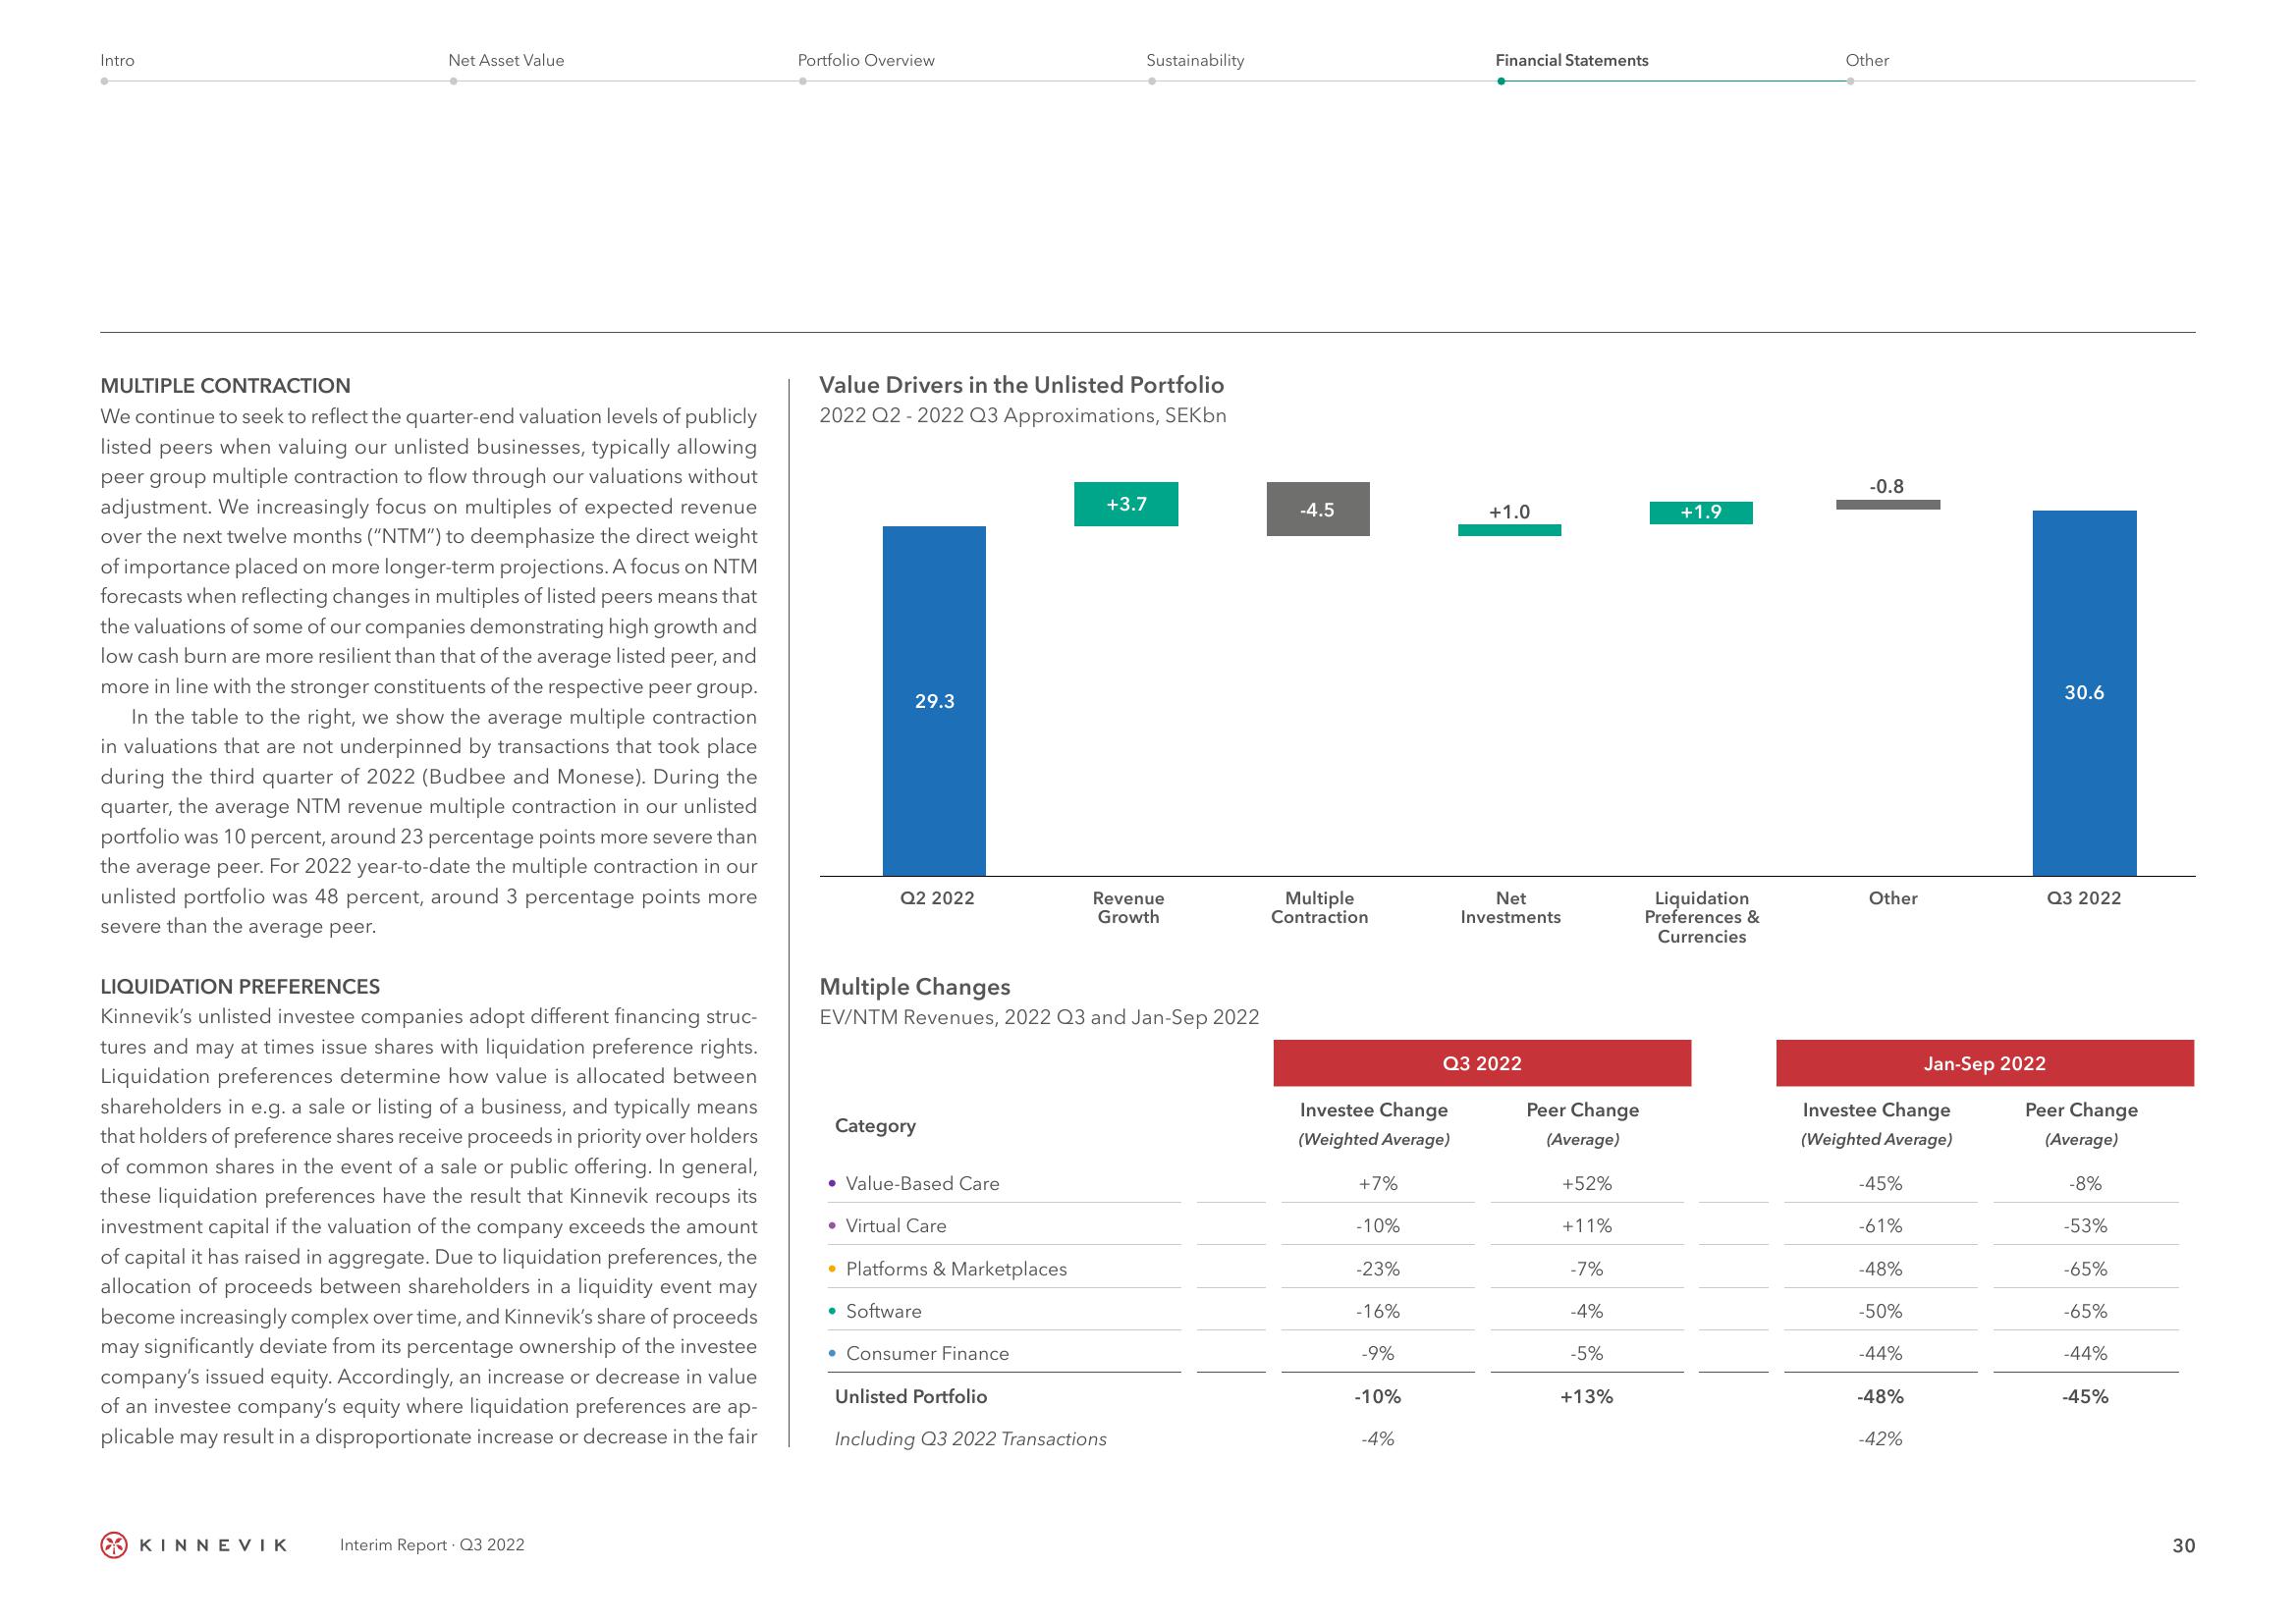
In the table to the right, we show the average multiple contraction
in valuations that are not underpinned by transactions that took place
during the third quarter of 2022 (Budbee and Monese). During the
quarter, the average NTM revenue multiple contraction in our unlisted
portfolio was 10 percent, around 23 percentage points more severe than
the average peer. For 2022 year-to-date the multiple contraction in our
unlisted portfolio was 48 percent, around 3 percentage points more
severe than the average peer.
LIQUIDATION PREFERENCES
Kinnevik's unlisted investee companies adopt different financing struc-
tures and may at times issue shares with liquidation preference rights.
Liquidation preferences determine how value is allocated between
shareholders in e.g. a sale or listing of a business, and typically means
that holders of preference shares receive proceeds in priority over holders
of common shares in the event of a sale or public offering. In general,
these liquidation preferences have the result that Kinnevik recoups its
investment capital if the valuation of the company exceeds the amount
of capital it has raised in aggregate. Due to liquidation preferences, the
allocation of proceeds between shareholders in a liquidity event may
become increasingly complex over time, and Kinnevik's share of proceeds
may significantly deviate from its percentage ownership of the investee
company's issued equity. Accordingly, an increase or decrease in value
of an investee company's equity where liquidation preferences are ap-
plicable may result in a disproportionate increase or decrease in the fair
KINNEVIK
Interim Report Q3 2022
Portfolio Overview
Value Drivers in the Unlisted Portfolio
2022 Q2-2022 Q3 Approximations, SEKbn
I
29.3
Q2 2022
Category
• Value-Based Care
• Virtual Care
Multiple Changes
EV/NTM Revenues, 2022 Q3 and Jan-Sep 2022
• Platforms & Marketplaces
• Software
Sustainability
• Consumer Finance
+3.7
Revenue
Growth
Unlisted Portfolio
Including Q3 2022 Transactions
-4.5
Multiple
Contraction
Investee Change
(Weighted Average)
+7%
-10%
-23%
-16%
-9%
-10%
-4%
Financial Statements
+1.0
Net
Investments
Q3 2022
Peer Change
(Average)
+52%
+11%
-7%
-4%
-5%
+13%
+1.9
Liquidation
Preferences &
Currencies
Other
-0.8
Other
Investee Change
(Weighted Average)
-45%
-61%
-48%
Jan-Sep 2022
-50%
-44%
-48%
-42%
30.6
Q3 2022
Peer Change
(Average)
-8%
-53%
-65%
-65%
-44%
-45%
30View entire presentation