CorpAcq SPAC Presentation Deck
34
Market Leadership Analysis - Key
3B Comparable Companies Deep Dive
Primary End-Markets
Diversified Industrials
Trade
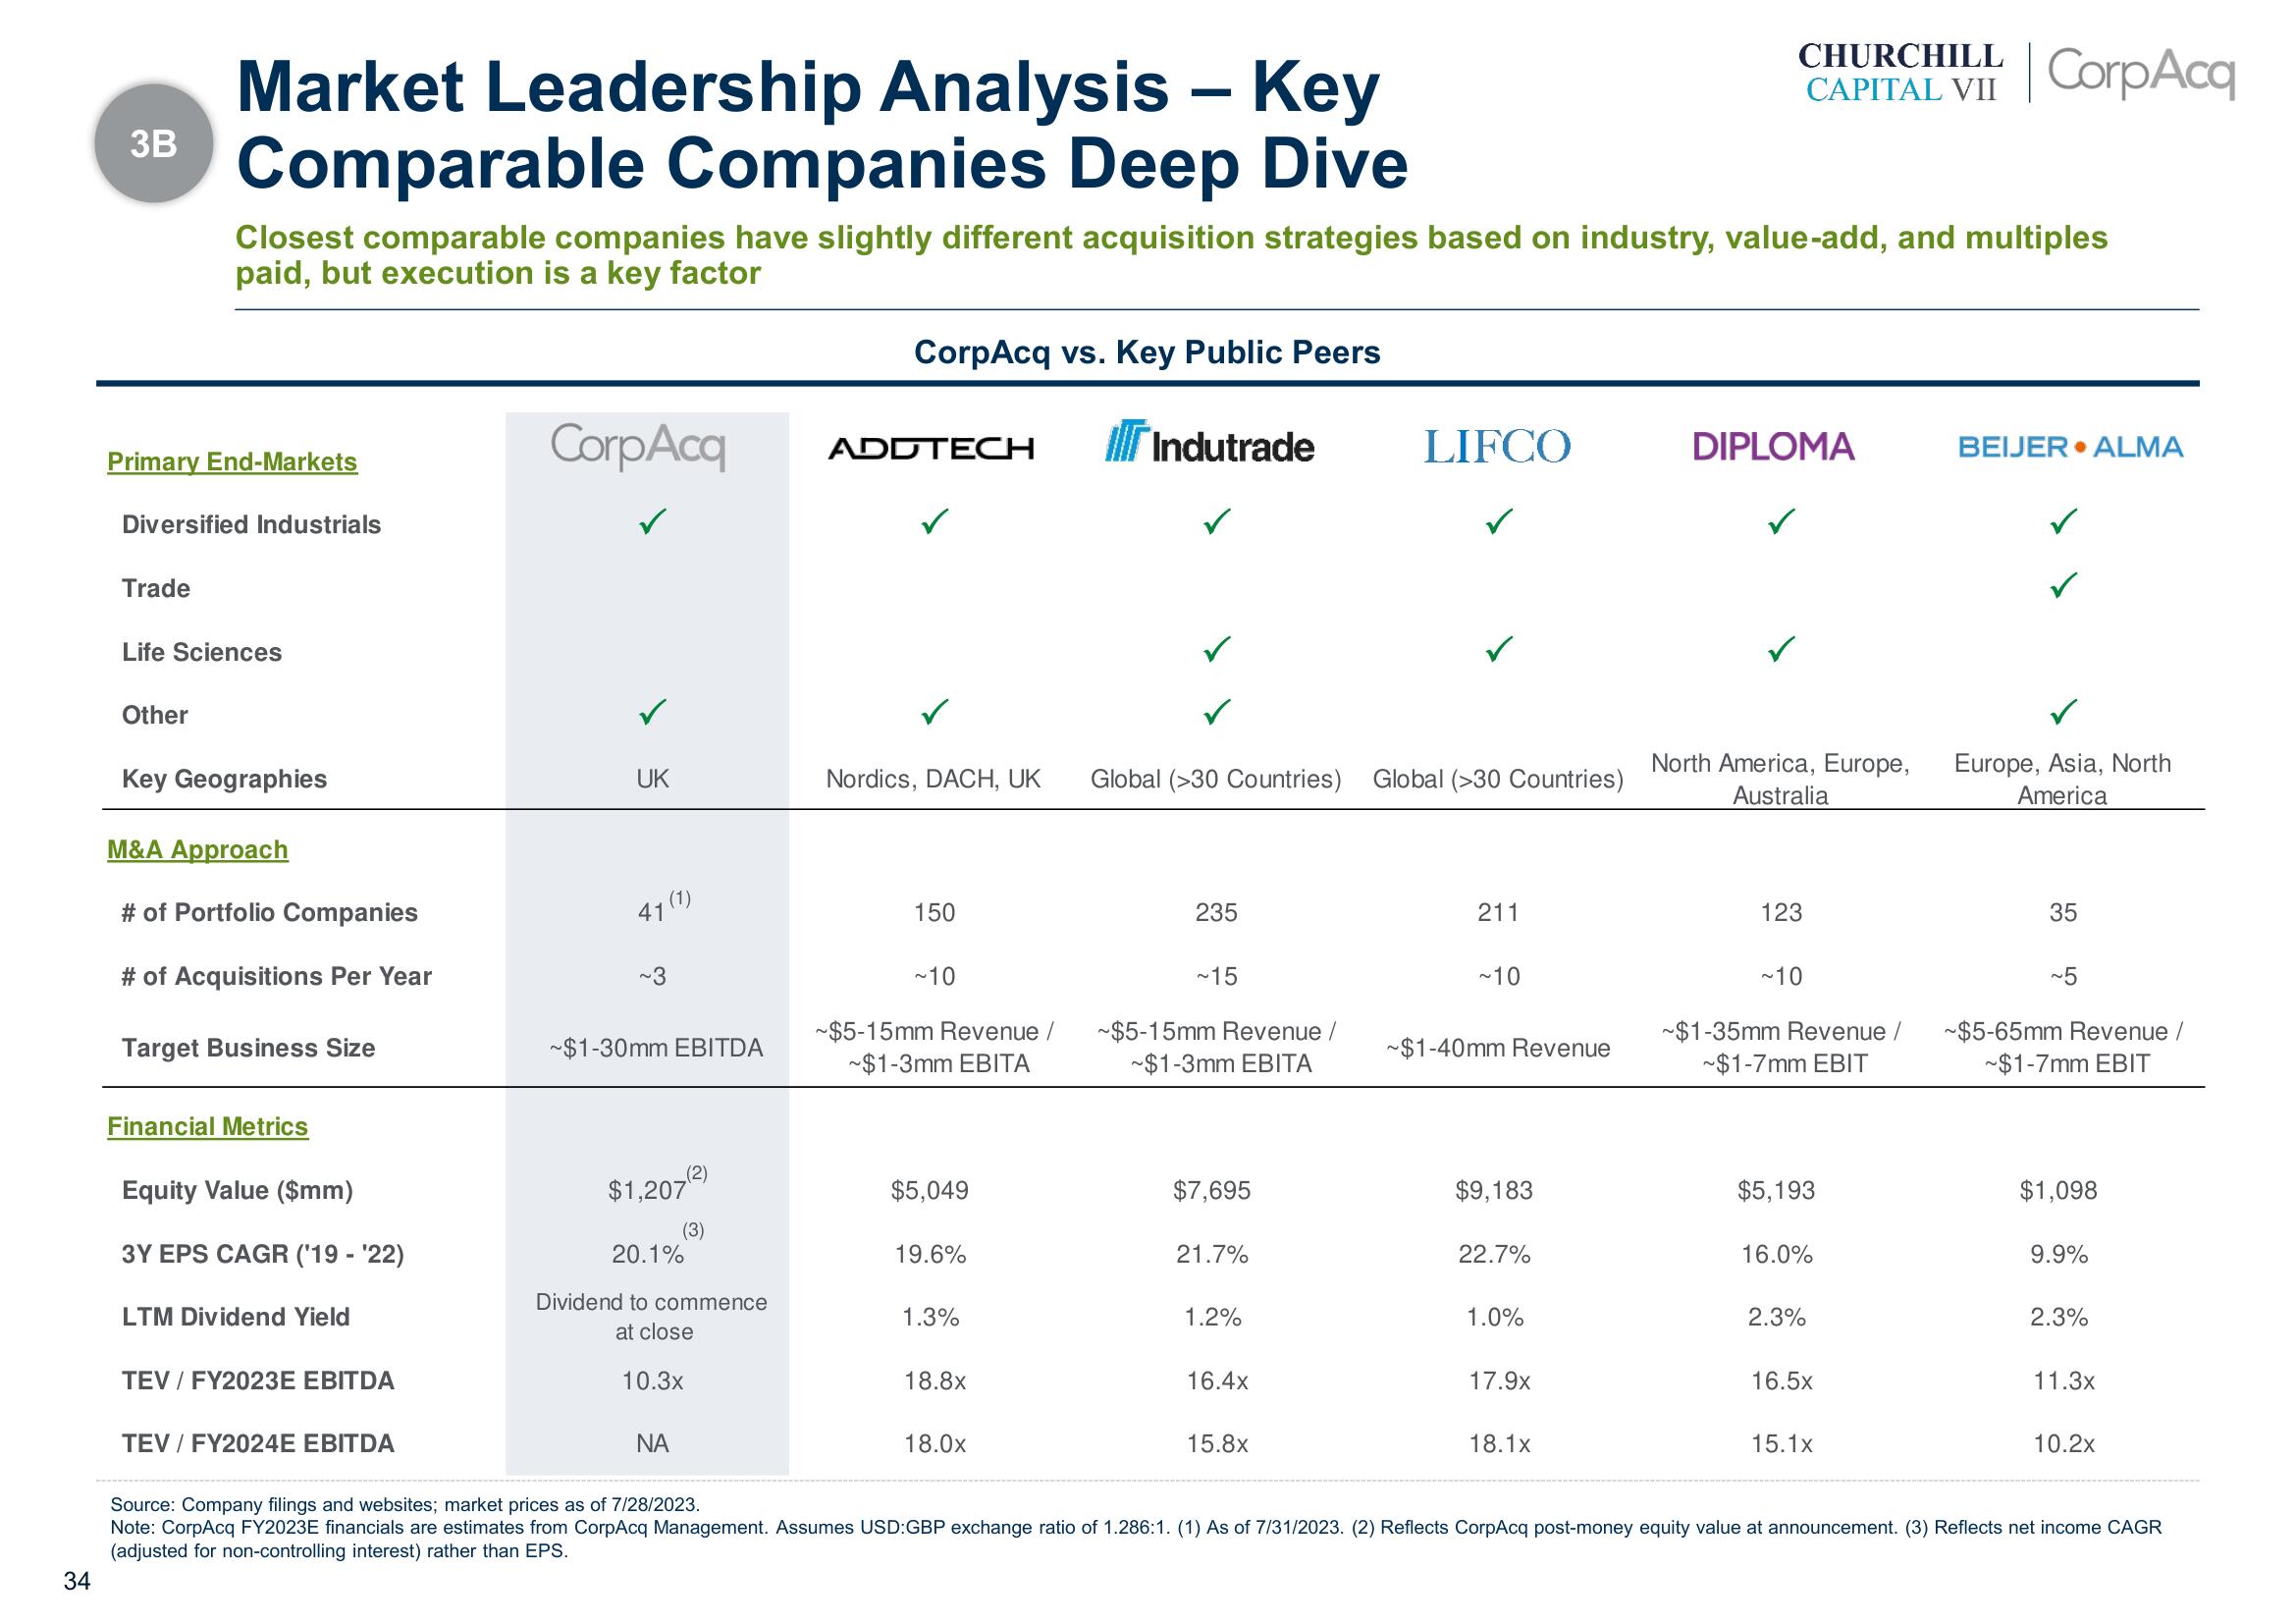
Closest comparable companies have slightly different acquisition strategies based on industry, value-add, and multiples
paid, but execution is a key factor
Life Sciences
Other
Key Geographies
M&A Approach
# of Portfolio Companies
# of Acquisitions Per Year
Target Business Size
Financial Metrics
Equity Value ($mm)
3Y EPS CAGR ('19 - '22)
LTM Dividend Yield
TEV / FY2023E EBITDA
TEV / FY2024E EBITDA
CorpAcq
UK
47 (1)
-3
~$1-30mm EBITDA
(2)
$1,207
(3)
20.1%
Dividend to commence
at close
10.3x
ΝΑ
CorpAcq vs. Key Public Peers
Indutrade
ADDTECH
Nordics, DACH, UK
150
~10
~$5-15mm Revenue /
~$1-3mm EBITA
$5,049
19.6%
1.3%
18.8x
18.0x
Global (>30 Countries) Global (>30 Countries)
235
~15
~$5-15mm Revenue /
~$1-3mm EBITA
$7,695
21.7%
1.2%
16.4x
LIFCO
15.8x
211
~10
~$1-40mm Revenue
$9,183
22.7%
1.0%
17.9x
CHURCHILL
CAPITAL VII CorpAcq
18.1x
DIPLOMA
North America, Europe,
Australia
123
~10
~$1-35mm Revenue /
~$1-7mm EBIT
$5,193
16.0%
2.3%
16.5x
15.1x
BEIJER ALMA
Europe, Asia, North
America
35
~5
~$5-65mm Revenue /
~$1-7mm EBIT
$1,098
9.9%
2.3%
11.3x
10.2x
Source: Company filings and websites; market prices as of 7/28/2023.
Note: CorpAcq FY2023E financials are estimates from CorpAcq Management. Assumes USD:GBP exchange ratio of 1.286:1. (1) As of 7/31/2023. (2) Reflects CorpAcq post-money equity value at announcement. (3) Reflects net income CAGR
(adjusted for non-controlling interest) rather than EPS.View entire presentation