Energy Vault SPAC Presentation Deck
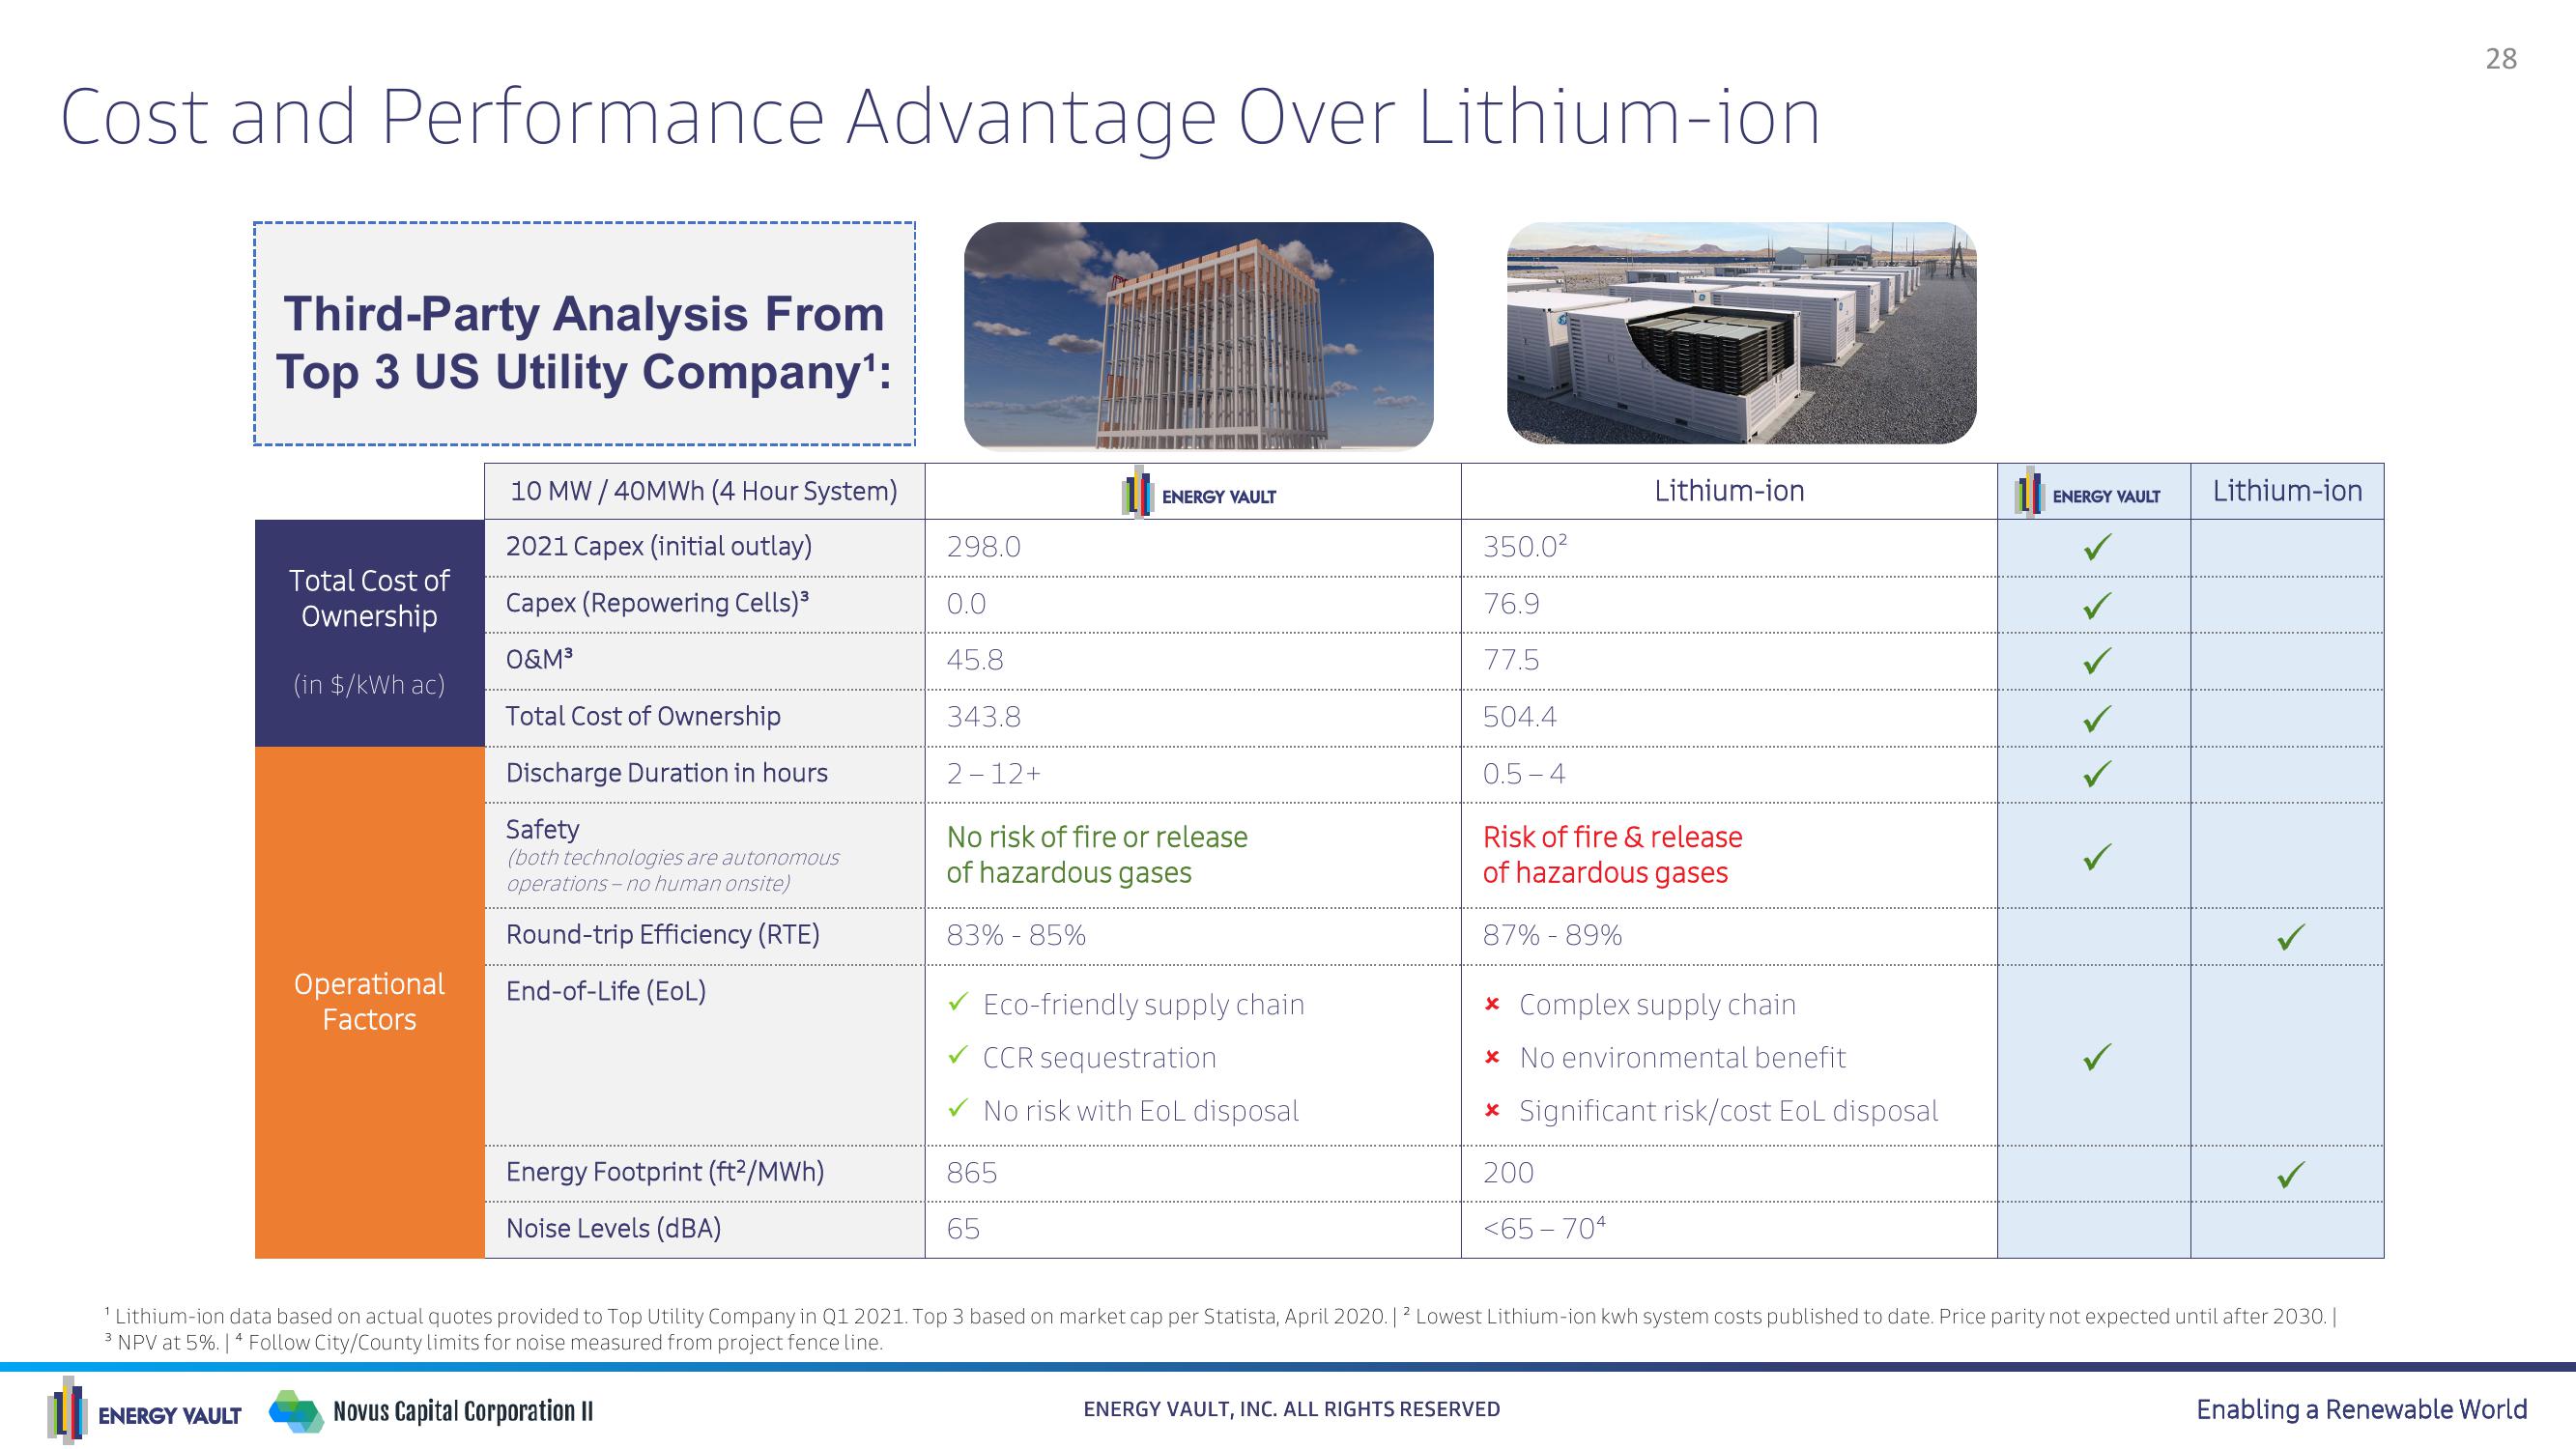
Cost and Performance Advantage Over Lithium-ion
Third-Party Analysis From
Top 3 US Utility Company¹:
Total Cost of
Ownership
(in $/kWh ac)
ENERGY VAULT
Operational
Factors
10 MW / 40MWh (4 Hour System)
2021 Capex (initial outlay)
Capex (Repowering Cells) ³
O&M³
Total Cost of Ownership
Discharge Duration in hours
Safety
(both technologies are autonomous
operations-no human onsite)
Round-trip Efficiency (RTE)
End-of-Life (EOL)
Energy Footprint (ft²/MWh)
Noise Levels (dBA)
298.0
0.0
45.8
343.8
2-12+
No risk of fire or release
of hazardous gases
83%-85%
ENERGY VAULT
Eco-friendly supply chain
CCR sequestration
No risk with EoL disposal
865
65
WE
350.0²
76.9
77.5
504.4
0.5-4
Risk of fire & release
of hazardous gases
87% -89%
Lithium-ion
* Complex supply chain
* No environmental benefit
* Significant risk/cost EoL disposal
200
<65-704
ENERGY VAULT, INC. ALL RIGHTS RESERVED
ENERGY VAULT
Lithium-ion
¹ Lithium-ion data based on actual quotes provided to Top Utility Company in Q1 2021. Top 3 based on market cap per Statista, April 2020. | ² Lowest Lithium-ion kwh system costs published to date. Price parity not expected until after 2030. |
3 NPV at 5%. | 4 Follow City/County limits for noise measured from project fence line.
Novus Capital Corporation II
✓
28
Enabling a Renewable WorldView entire presentation