Main Street Capital Investor Day Presentation Deck
MAIN's Strategy Consistently Produces Differentiated
Returns
Total Shareholder Returns
are Better Indicator of
Economic Value Creation
for Shareholders
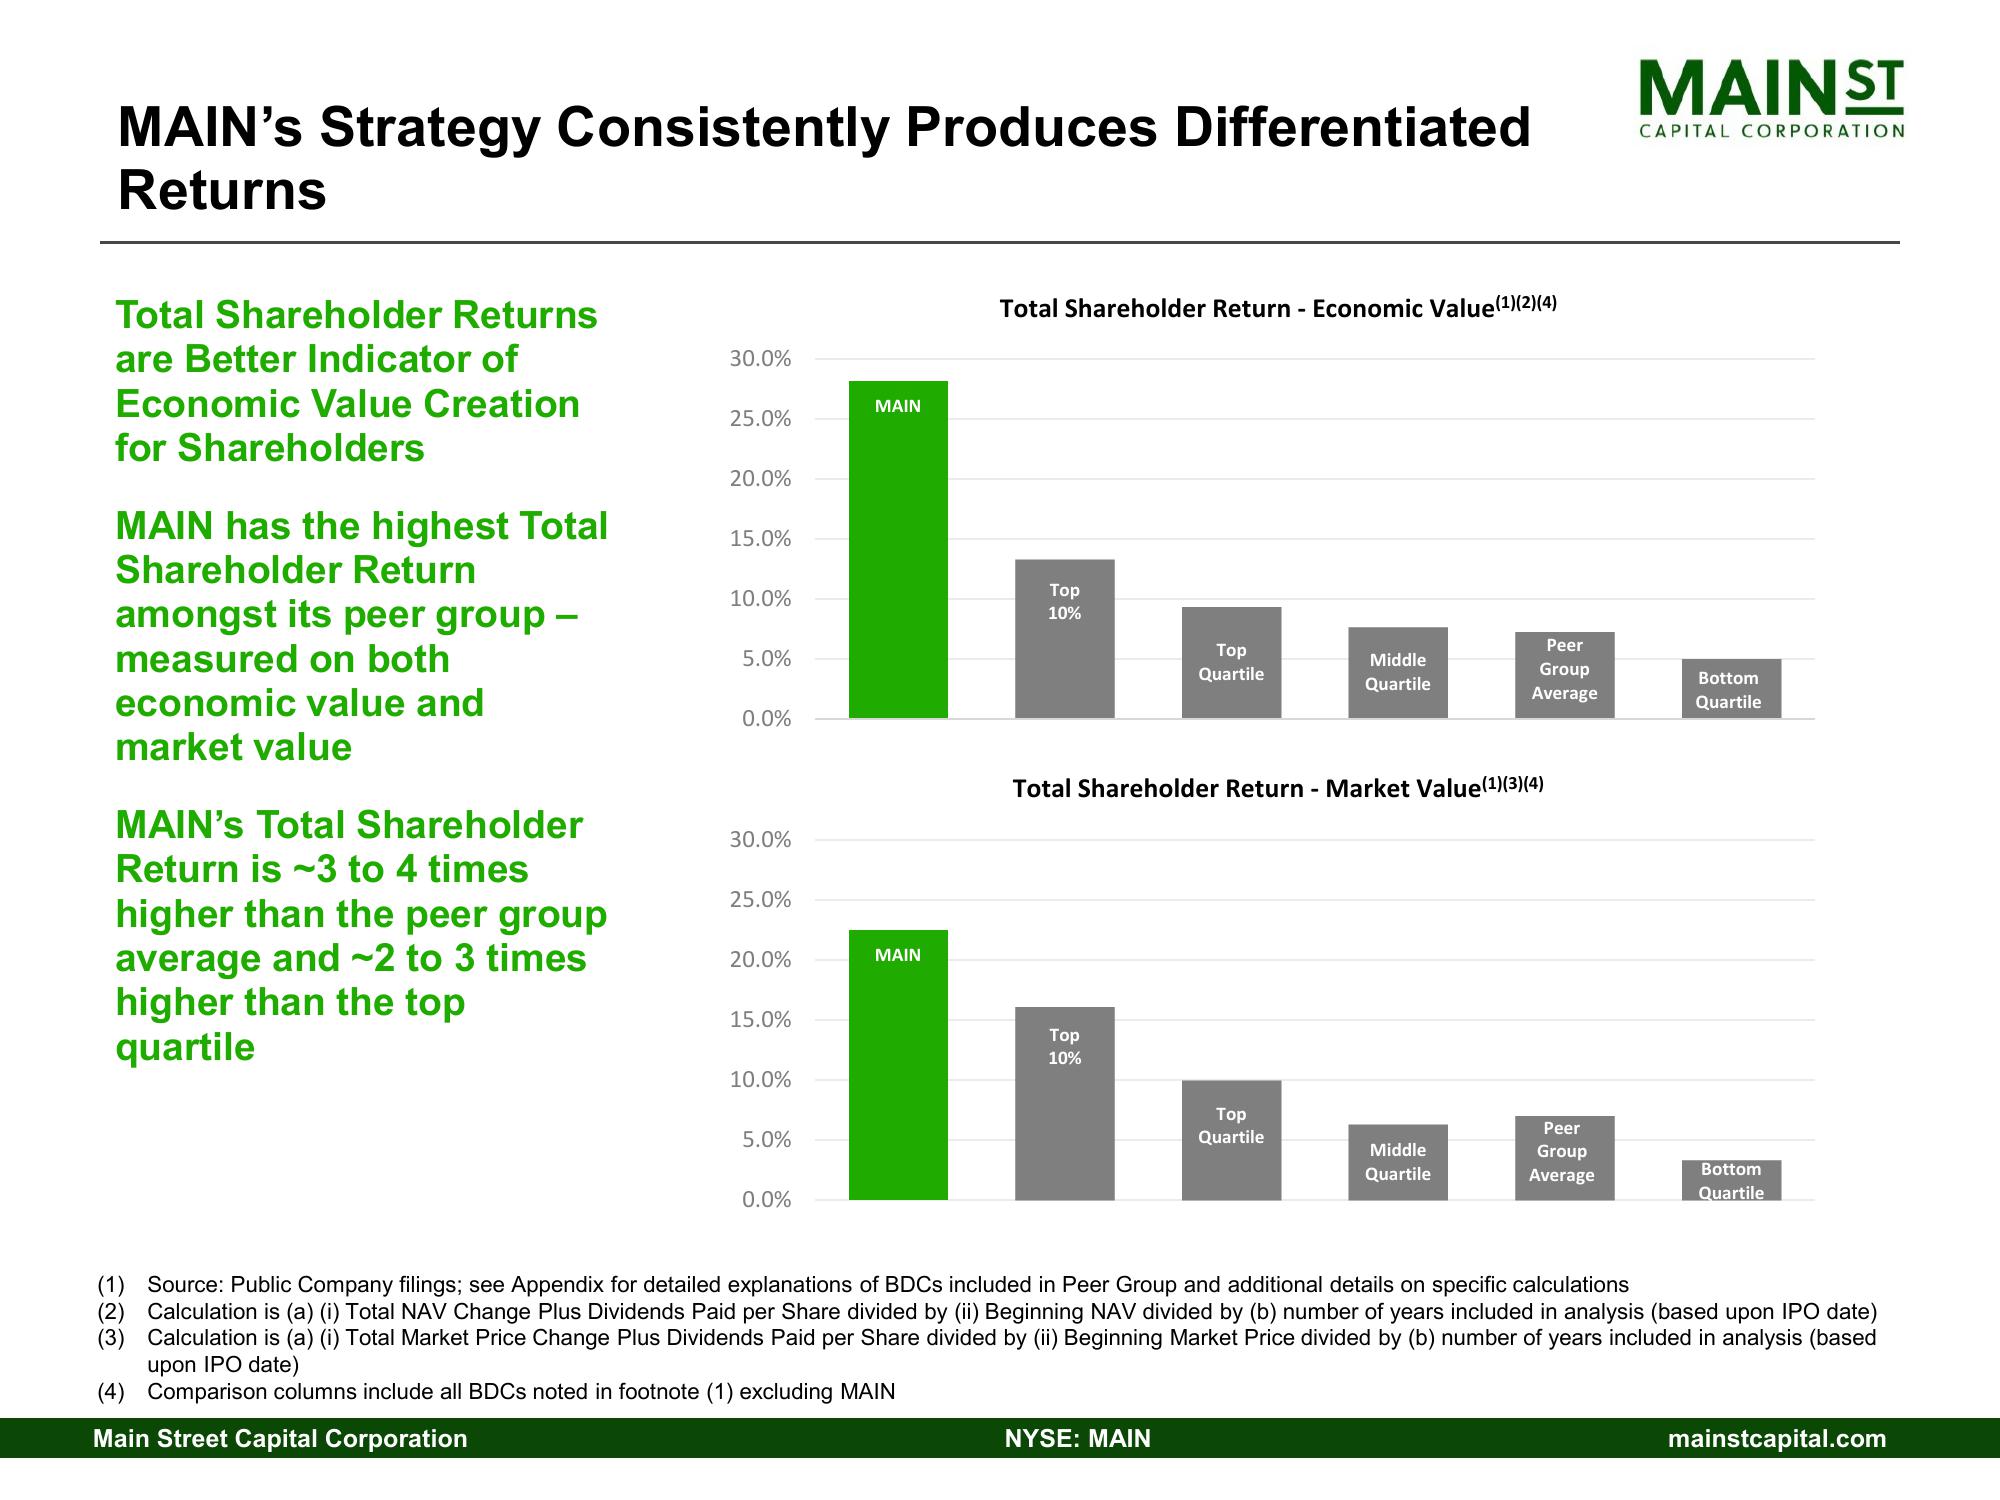
MAIN has the highest Total
Shareholder Return
amongst its peer group -
measured on both
economic value and
market value
MAIN's Total Shareholder
Return is 3 to 4 times
higher than the peer group
average and ~2 to 3 times
higher than the top
quartile
30.0%
25.0%
T
20.0%
15.0%
10.0%
5.0%
0.0%
30.0%
25.0%
20.0%
15.0%
10.0%
5.0%
0.0%
MAIN
MAIN
(4) Comparison columns include all BDCs noted in footnote (1) excluding MAIN
Main Street Capital Corporation
Total Shareholder Return - Economic Value(1)(2)(4)
Top
10%
Top
10%
Top
Quartile
Total Shareholder Return - Market Value(¹)(3)(4)
NYSE: MAIN
Middle
Quartile
Top
Quartile
Peer
Group
Average
Middle
Quartile
Peer
Group
Average
MAINST
CAPITAL CORPORATION
(1) Source: Public Company filings; Appendix for detailed explanations of BDCs included in Peer Group and additional details on specific calculations
(2) Calculation is (a) (i) Total NAV Change Plus Dividends Paid per Share divided by (ii) Beginning NAV divided by (b) number of years included in analysis (based upon IPO date)
(3) Calculation is (a) (i) Total Market Price Change Plus Dividends Paid per Share divided by (ii) Beginning Market Price divided by (b) number of years included in analysis (based
upon IPO date)
Bottom
Quartile
Bottom
Quartile
mainstcapital.comView entire presentation