Tesla Results Presentation Deck
26
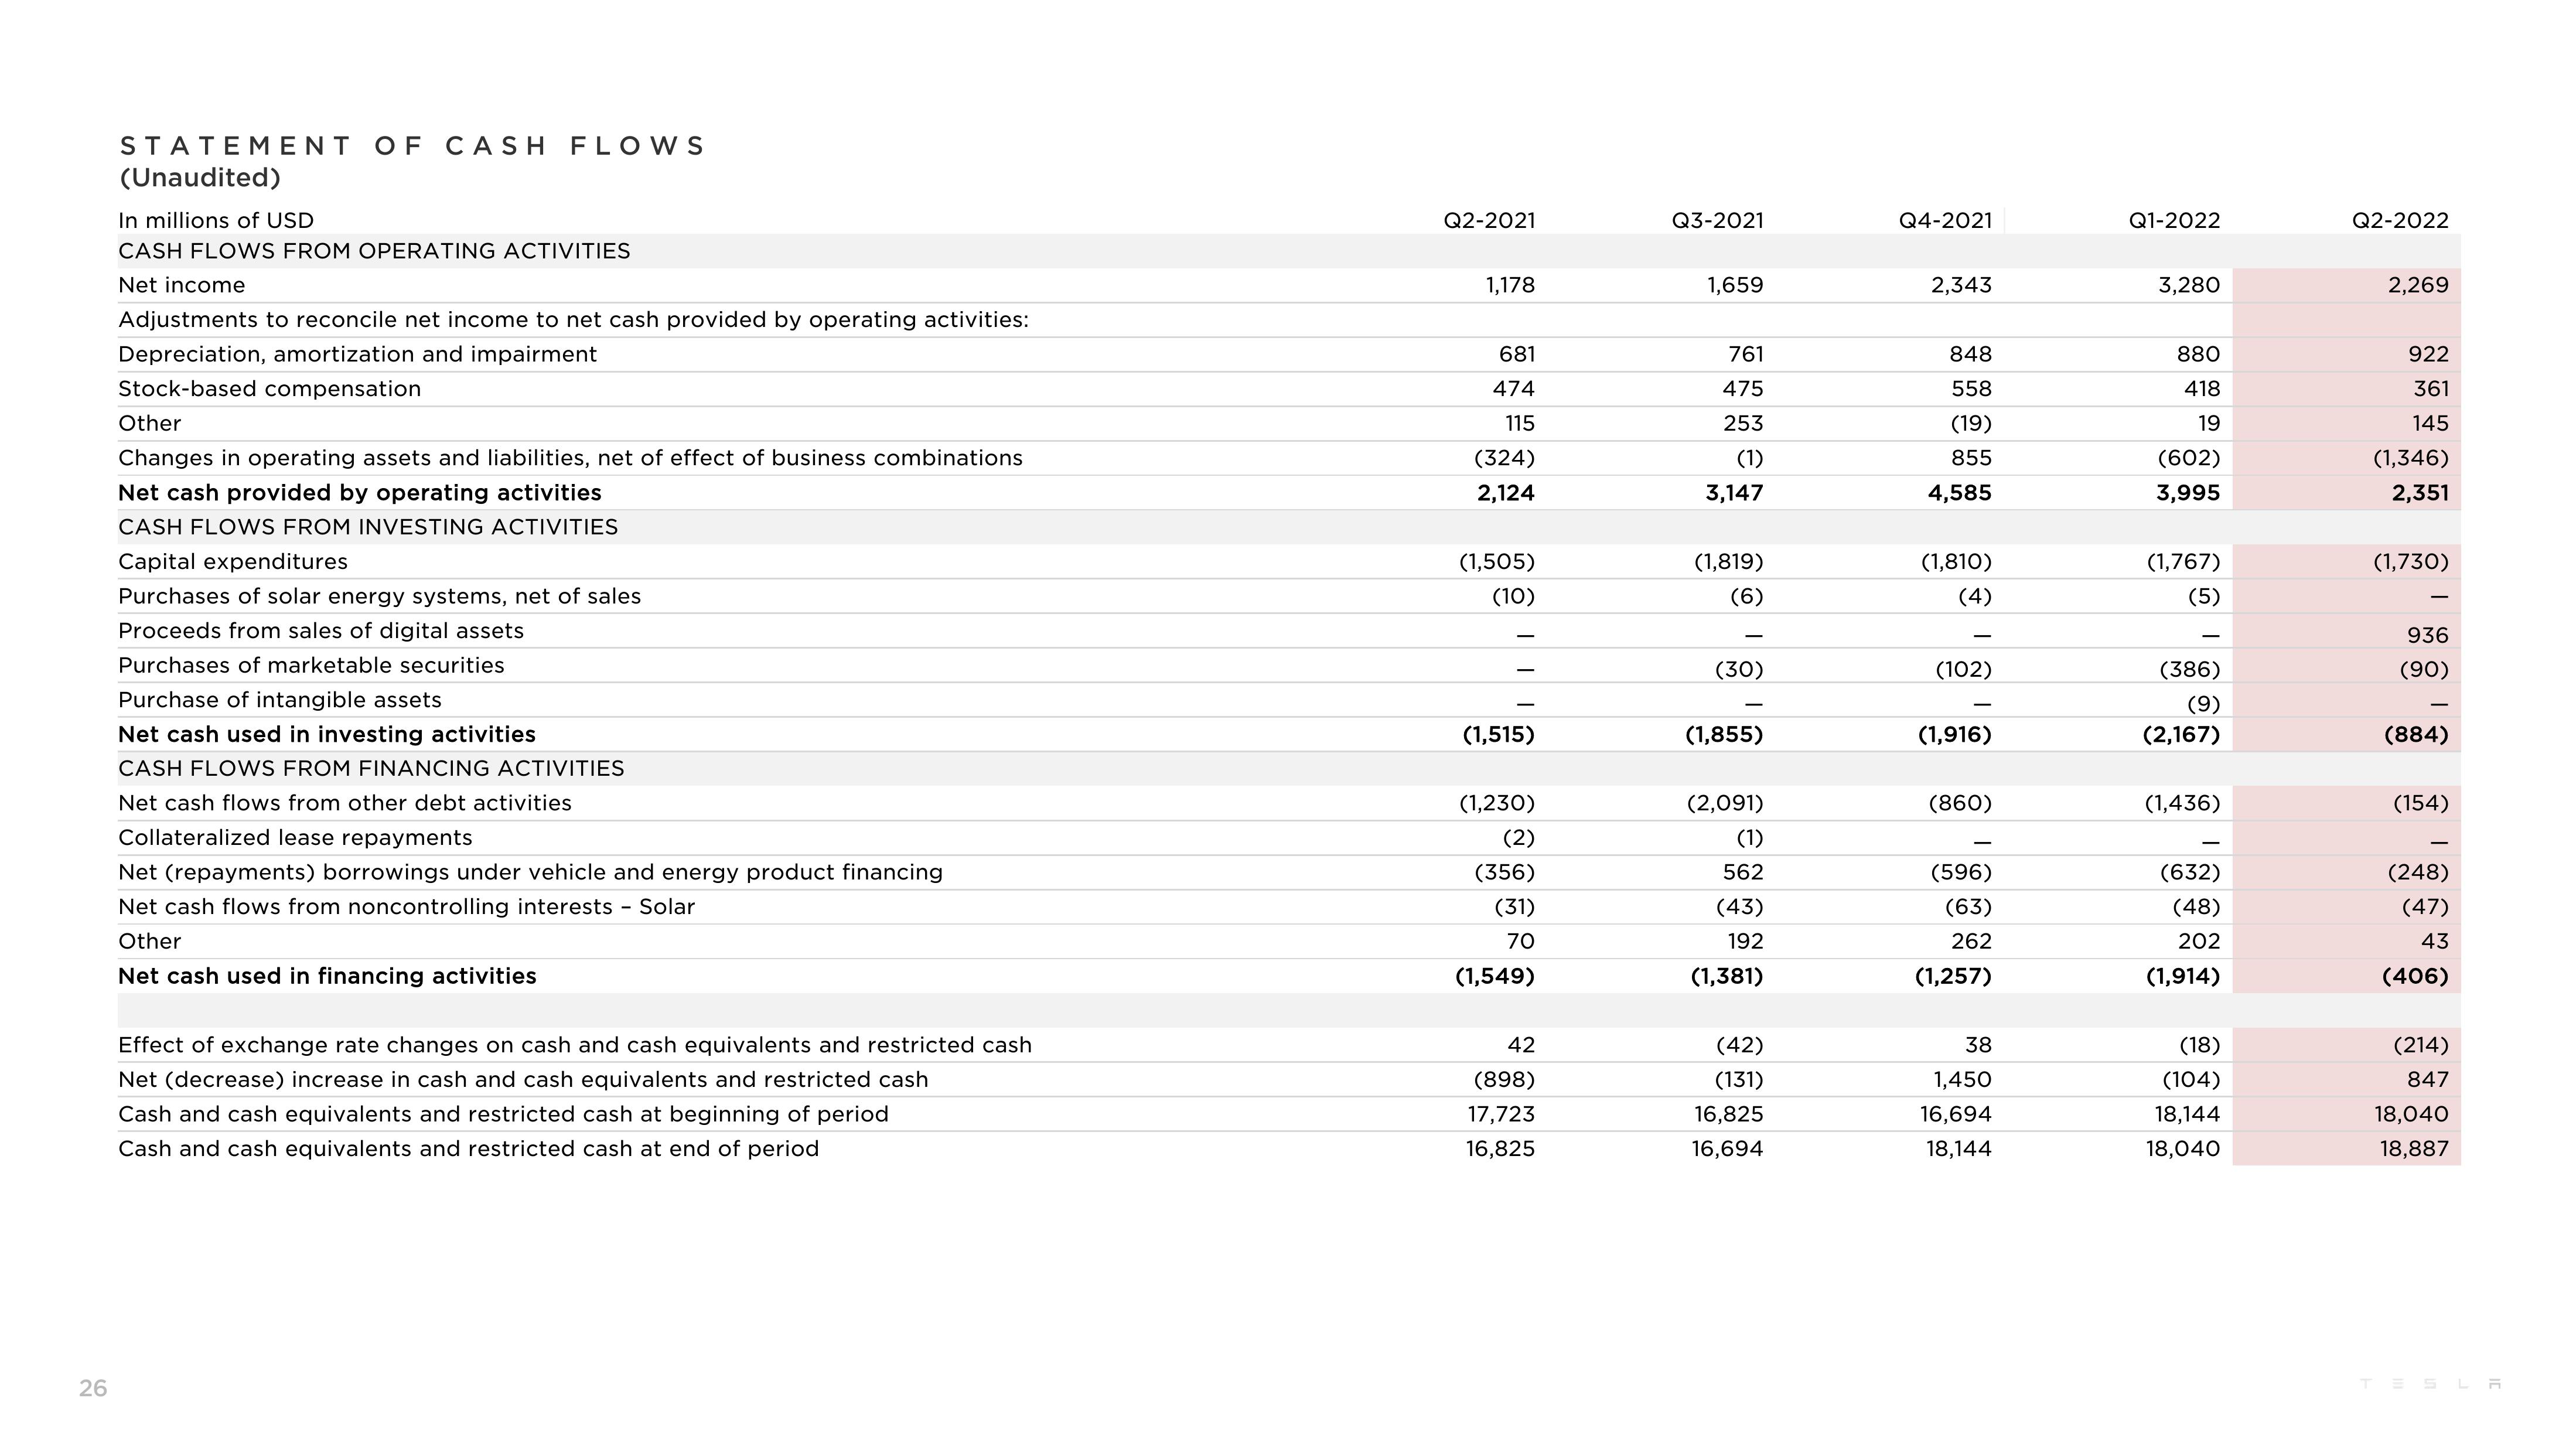
STATEMENT OF CASH FLOWS
(Unaudited)
In millions of USD
CASH FLOWS FROM OPERATING ACTIVITIES
Net income
Adjustments to reconcile net income to net cash provided by operating activities:
Depreciation, amortization and impairment
Stock-based compensation
Other
Changes in operating assets and liabilities, net of effect of business combinations
Net cash provided by operating activities
CASH FLOWS FROM INVESTING ACTIVITIES
Capital expenditures
Purchases of solar energy systems, net of
Proceeds from sales of digital assets
Purchases of marketable securities
Purchase of intangible assets
Net cash used in investing activities
CASH FLOWS FROM FINANCING ACTIVITIES
Net cash flows from other debt activities
Collateralized lease repayments
Net (repayments) borrowings under vehicle and energy product financing
Net cash flows from noncontrolling interests - Solar
Other
Net cash used in financing activities
Effect of exchange rate changes on cash and cash equivalents and restricted cash
Net (decrease) increase in cash and cash equivalents and restricted cash
Cash and cash equivalents and restricted cash at beginning of period
Cash and cash equivalents and restricted cash at end of period
Q2-2021
1,178
681
474
115
(324)
2,124
(1,505)
(1,515)
(1,230)
(2)
(356)
(31)
70
(1,549)
42
(898)
17,723
16,825
Q3-2021
1,659
761
475
253
(1)
3,147
(1,819)
(30)
(1,855)
(2,091)
(1)
562
(43)
192
(1,381)
(42)
(131)
16,825
16,694
Q4-2021
2,343
848
558
(19)
855
4,585
(1,810)
(4)
(102)
(1,916)
(860)
(596)
(63)
262
(1,257)
38
1,450
16,694
18,144
Q1-2022
3,280
880
418
19
(602)
3,995
(1,767)
(5)
(386)
(9)
(2,167)
(1,436)
(632)
(48)
202
(1,914)
(18)
(104)
18,144
18,040
Q2-2022
2,269
922
361
145
(1,346)
2,351
(1,730)
936
(90)
(884)
(154)
(248)
(47)
43
(406)
(214)
847
18,040
18,887View entire presentation