Maersk Results Presentation Deck
Maersk Group
- Interim Report 03 2015
APM
TERMINALS
Contents
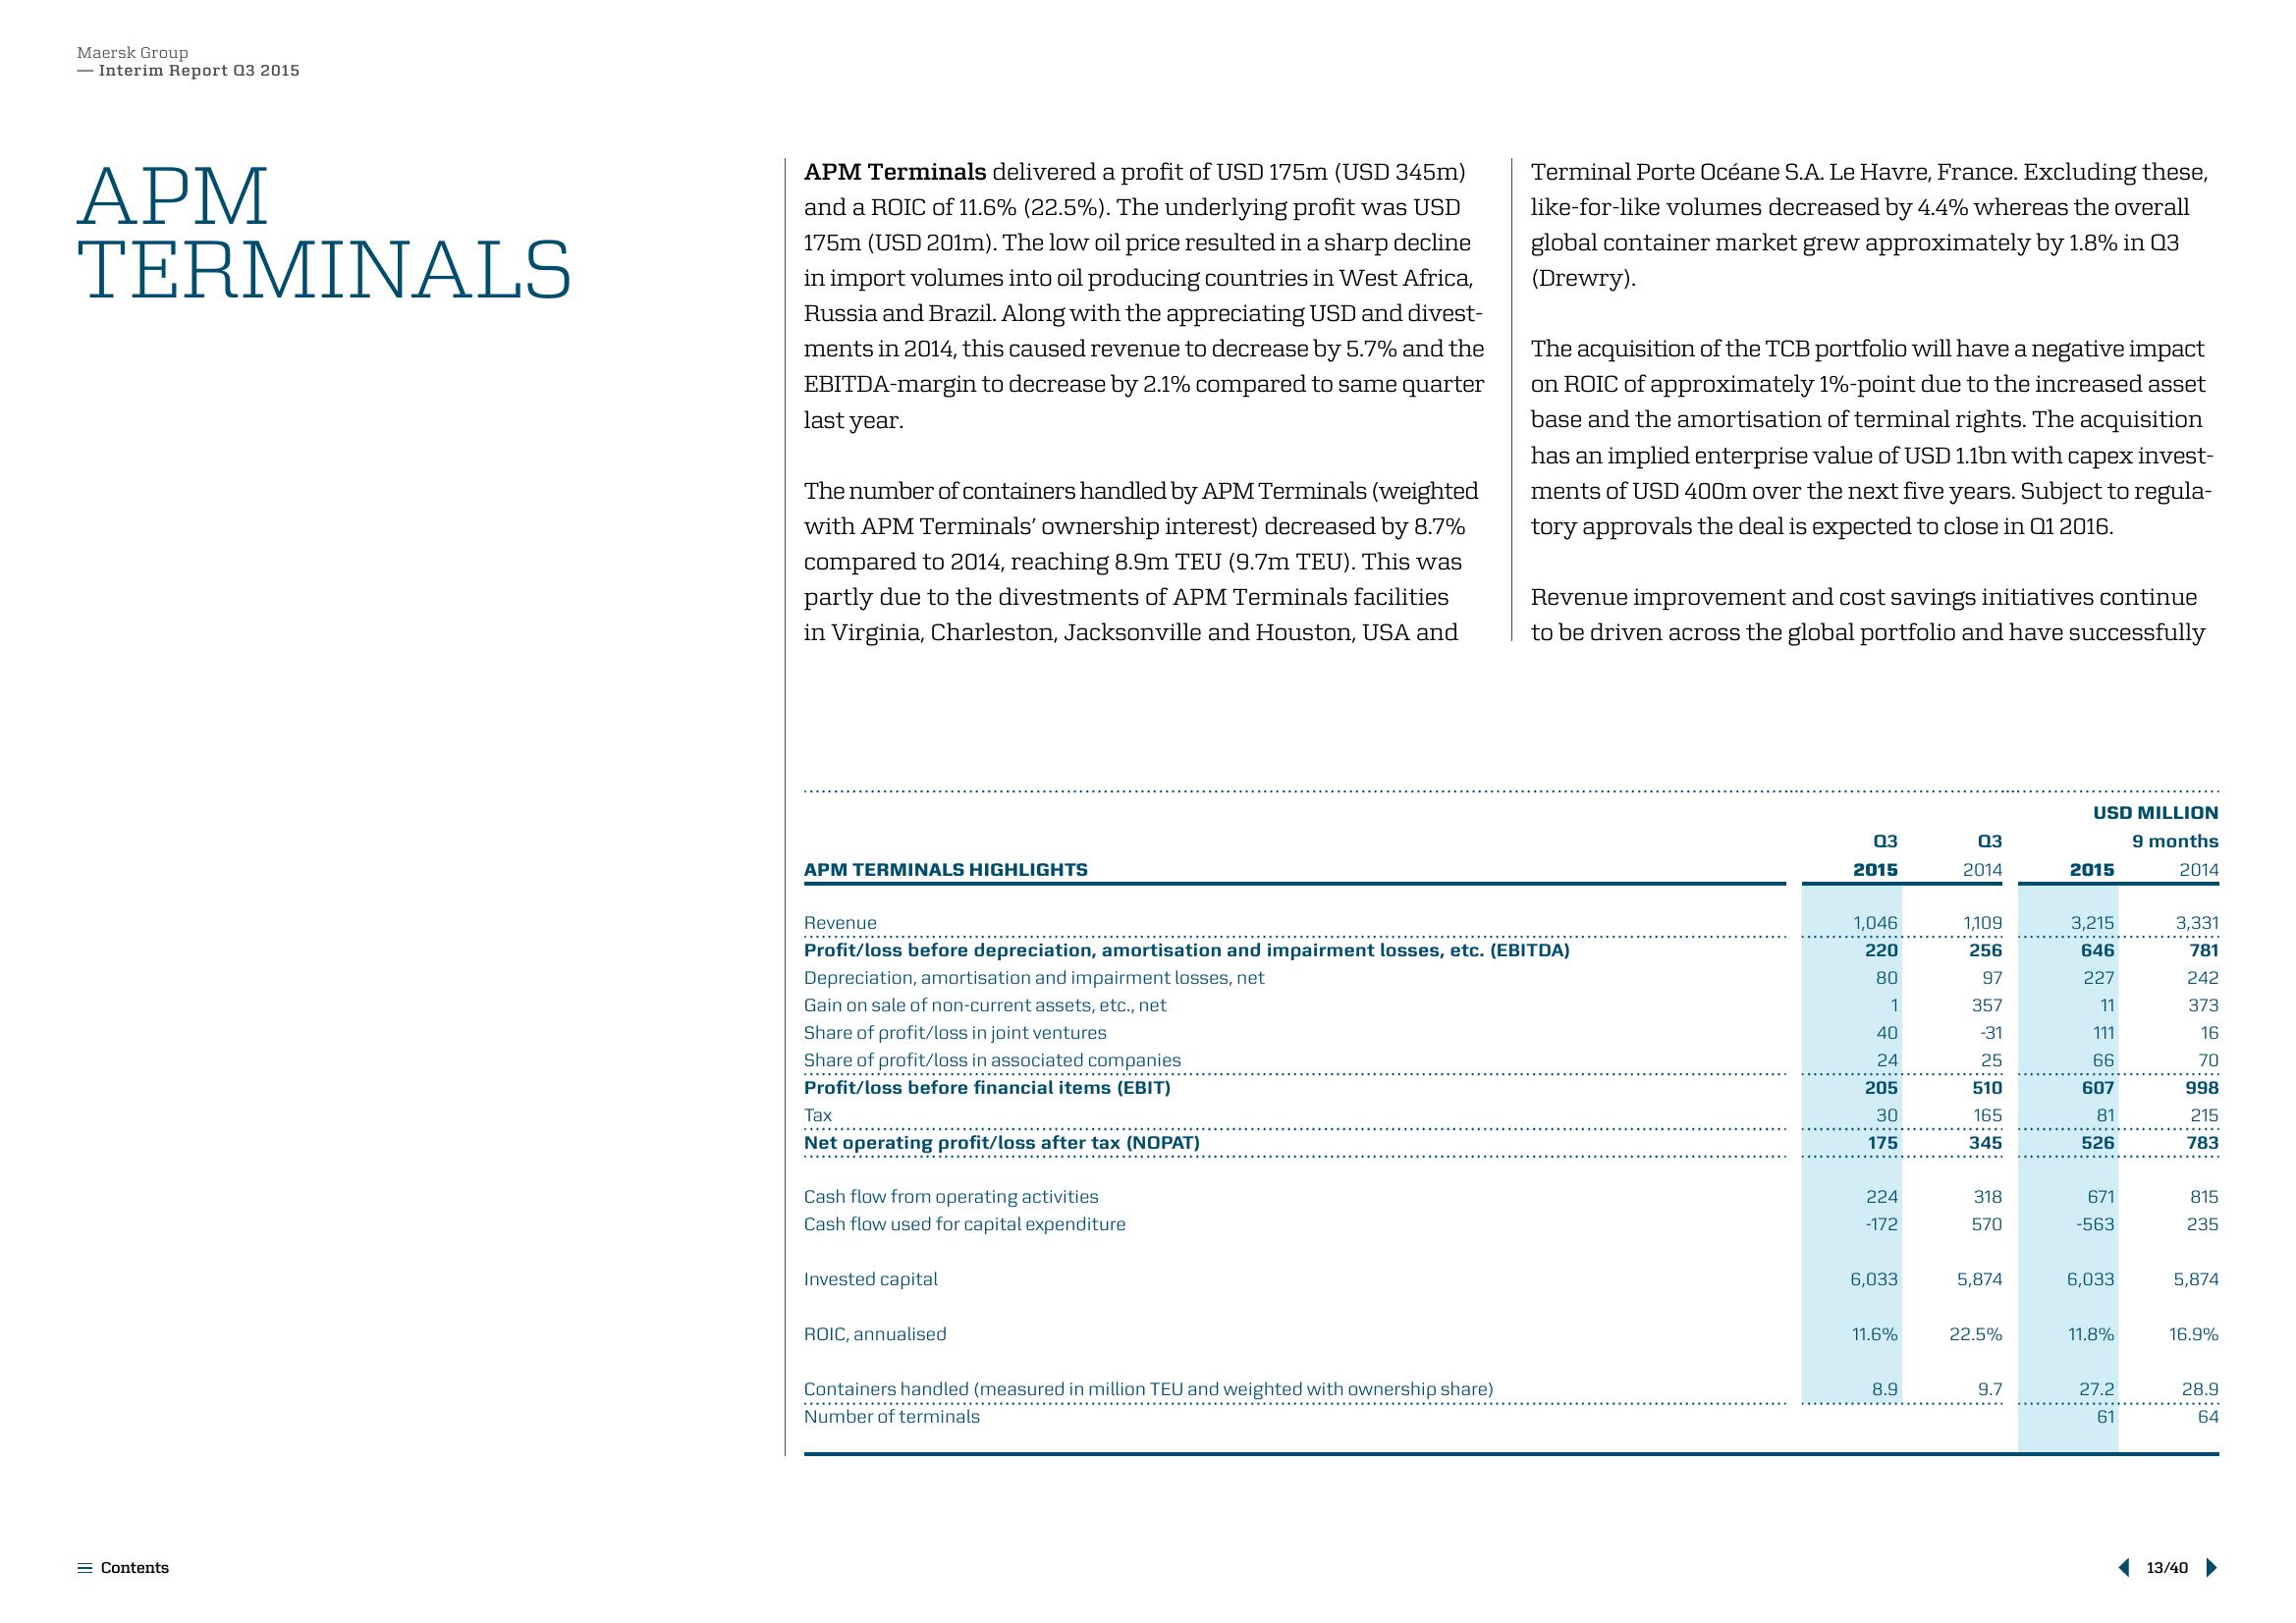
APM Terminals delivered a profit of USD 175m (USD 345m)
and a ROIC of 11.6% (22.5%). The underlying profit was USD
175m (USD 201m). The low oil price resulted in a sharp decline
in import volumes into oil producing countries in West Africa,
Russia and Brazil. Along with the appreciating USD and divest-
ments in 2014, this caused revenue to decrease by 5.7% and the
EBITDA-margin to decrease by 2.1% compared to same quarter
last year.
The number of containers handled by APM Terminals (weighted
with APM Terminals' ownership interest) decreased by 8.7%
compared to 2014, reaching 8.9m TEU (9.7m TEU). This was
partly due to the divestments of APM Terminals facilities
in Virginia, Charleston, Jacksonville and Houston, USA and
APM TERMINALS HIGHLIGHTS
..............
Tax
Net operating profit/loss after tax (NOPAT)
Revenue
***********
Profit/loss before depreciation, amortisation and impairment losses, etc. (EBITDA)
Depreciation, amortisation and impairment losses, net
Gain on sale of non-current assets, etc., net
Share of profit/loss in joint ventures
Share of profit/loss in associated companies
Profit/loss before financial items (EBIT)
Cash flow from operating activities
Cash flow used for capital expenditure
Invested capital
ROIC, annualised
Terminal Porte Océane S.A. Le Havre, France. Excluding these,
like-for-like volumes decreased by 4.4% whereas the overall
global container market grew approximately by 1.8% in 03
(Drewry).
Containers handled (measured in million TEU and weighted with ownership share)
Number of terminals
The acquisition of the TCB portfolio will have a negative impact
on ROIC of approximately 1%-point due to the increased asset
base and the amortisation of terminal rights. The acquisition
has an implied enterprise value of USD 1.1bn with capex invest-
ments of USD 400m over the next five years. Subject to regula-
tory approvals the deal is expected to close in Q1 2016.
Revenue improvement and cost savings initiatives continue
to be driven across the global portfolio and have successfully
03
2015
1,046
220
80
1
40
24
205
30
175
224
-172
6,033
11.6%
8.9
03
2014
1,109
256
97
357
-31
25
510
165
345
318
570
5,874
22.5%
9.7
USD MILLION
9 months
2014
2015
3,215
646
227
11
111
66
607
81
526
671
-563
6,033
11.8%
27.2
61
3,331
781
242
373
16
70
998
215
783
815
235
5,874
16.9%
28.9
64
13/40View entire presentation