Silicon Valley Bank Results Presentation Deck
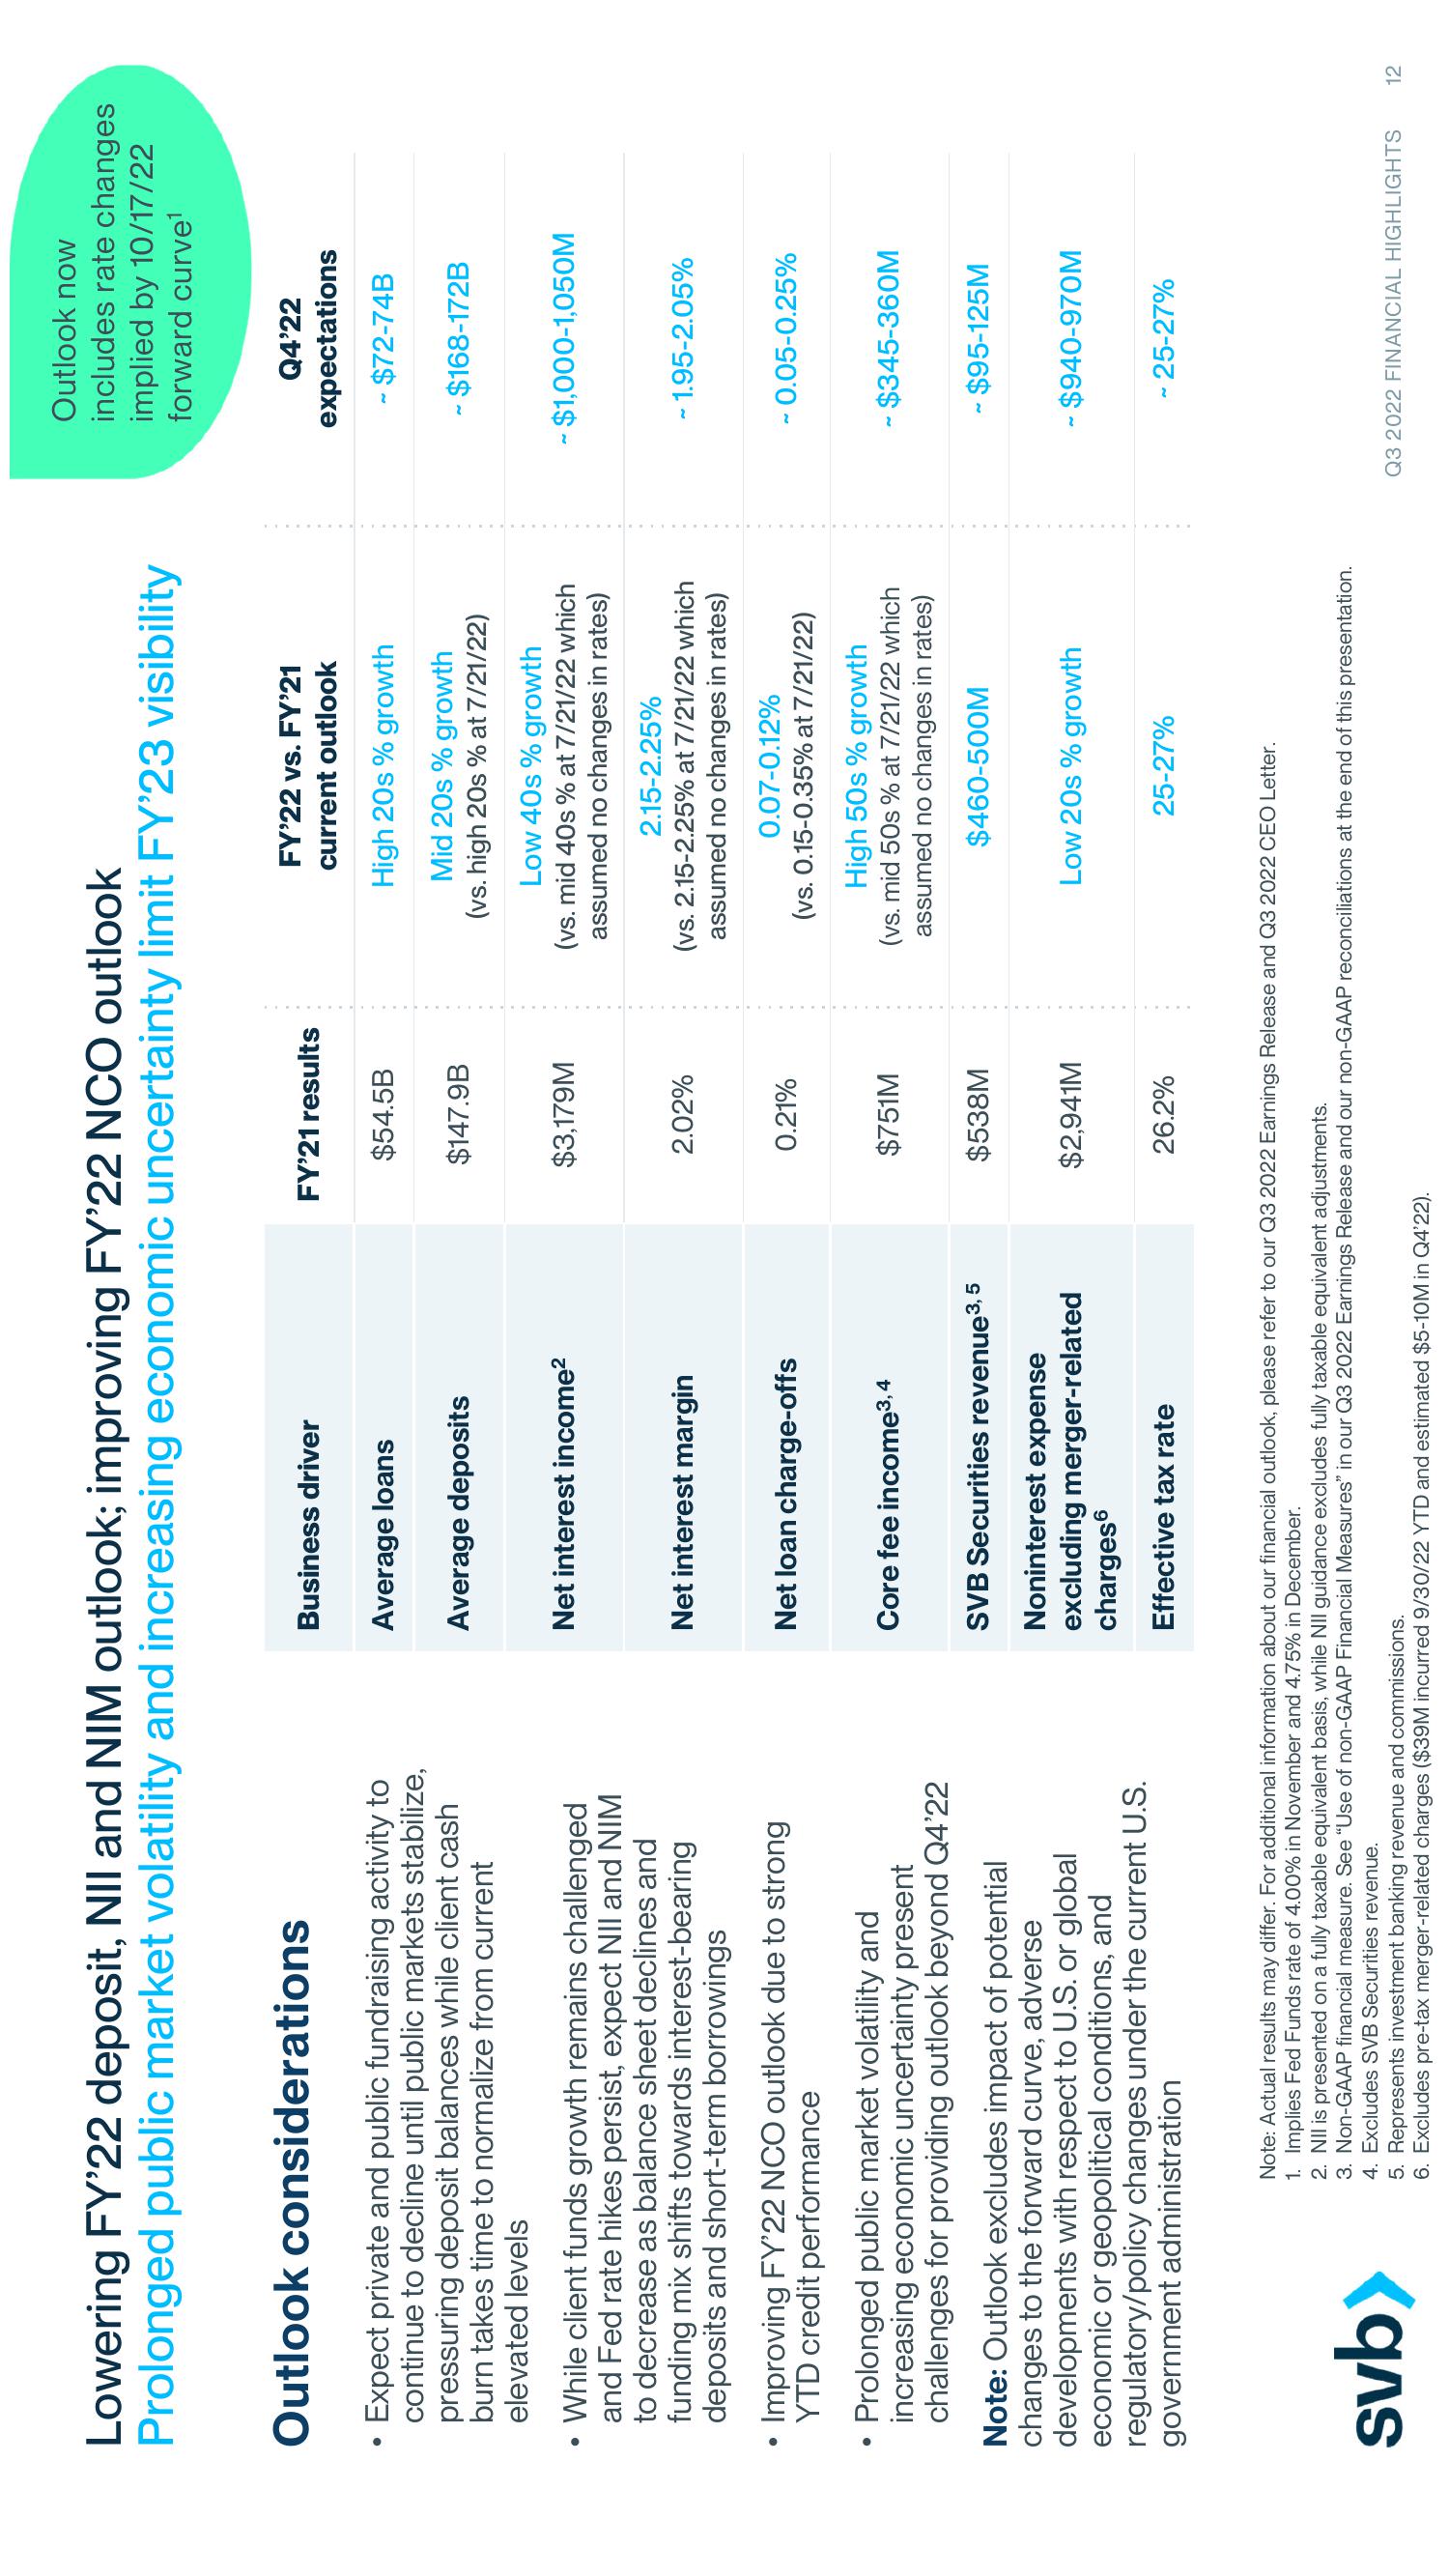
Lowering FY'22 deposit, NII and NIM outlook; improving FY'22 NCO outlook
Prolonged public market volatility and increasing economic uncertainty limit FY'23 visibility
Outlook considerations
• Expect private and public fundraising activity to
continue to decline until public markets stabilize,
pressuring deposit balances while client cash
burn takes time to normalize from current
elevated levels
While client funds growth remains challenged
and Fed rate hikes persist, expect NII and NIM
to decrease as balance sheet declines and
funding mix shifts towards interest-bearing
deposits and short-term borrowings
Improving FY'22 NCO outlook due to strong
YTD credit performance
• Prolonged public market volatility and
increasing economic uncertainty present
challenges for providing outlook beyond Q4'22
Note: Outlook excludes impact of potential
changes to the forward curve, adverse
developments with respect to U.S. or global
economic or geopolitical conditions, and
regulatory/policy changes under the current U.S.
government administration
svb>
Business driver
Average loans
Average deposits
Net interest income²
Net interest margin
Net loan charge-offs
Core fee income³,4
SVB Securities revenue ³,5
Noninterest expense
excluding merger-related
charges6
Effective tax rate
FY'21 results
$54.5B
$147.9B
5. Represents investment banking revenue and commissions.
6. Excludes pre-tax merger-related charges ($39M incurred 9/30/22 YTD and estimated $5-10M in Q4'22).
$3,179M
2.02%
0.21%
$751M
$538M
$2,941M
26.2%
FY'22 vs. FY'21
current outlook
High 20s % growth
Mid 20s % growth
(vs. high 20s % at 7/21/22)
Low 40s % growth
(vs. mid 40s % at 7/21/22 which
assumed no changes in rates)
2.15-2.25%
(vs. 2.15-2.25% at 7/21/22 which
assumed no changes in rates)
0.07-0.12%
(vs. 0.15-0.35% at 7/21/22)
High 50s % growth
(vs. mid 50s % at 7/21/22 which
assumed no changes in rates)
$460-500M
Low 20s % growth
25-27%
Note: Actual results may differ. For additional information about our financial outlook, please refer to our Q3 2022 Earnings Release and Q3 2022 CEO Letter.
1. Implies Fed Funds rate of 4.00% in November and 4.75% in December.
2. NII is presented on a fully taxable equivalent basis, while NII guidance excludes fully taxable equivalent adjustments.
3. Non-GAAP financial measure. See "Use of non-GAAP Financial Measures" in our Q3 2022 Earnings Release and our non-GAAP reconciliations at the end of this presentation.
4. Excludes SVB Securities revenue.
Outlook now
includes rate changes
implied by 10/17/22
forward curve¹
Q4'22
expectations
- $72-74B
- $168-172B
- $1,000-1,050M
~ 1.95-2.05%
~ 0.05-0.25%
- $345-360M
~ $95-125M
- $940-970M
~ 25-27%
Q3 2022 FINANCIAL HIGHLIGHTS 12View entire presentation