TPG Results Presentation Deck
Fee-Related Earnings
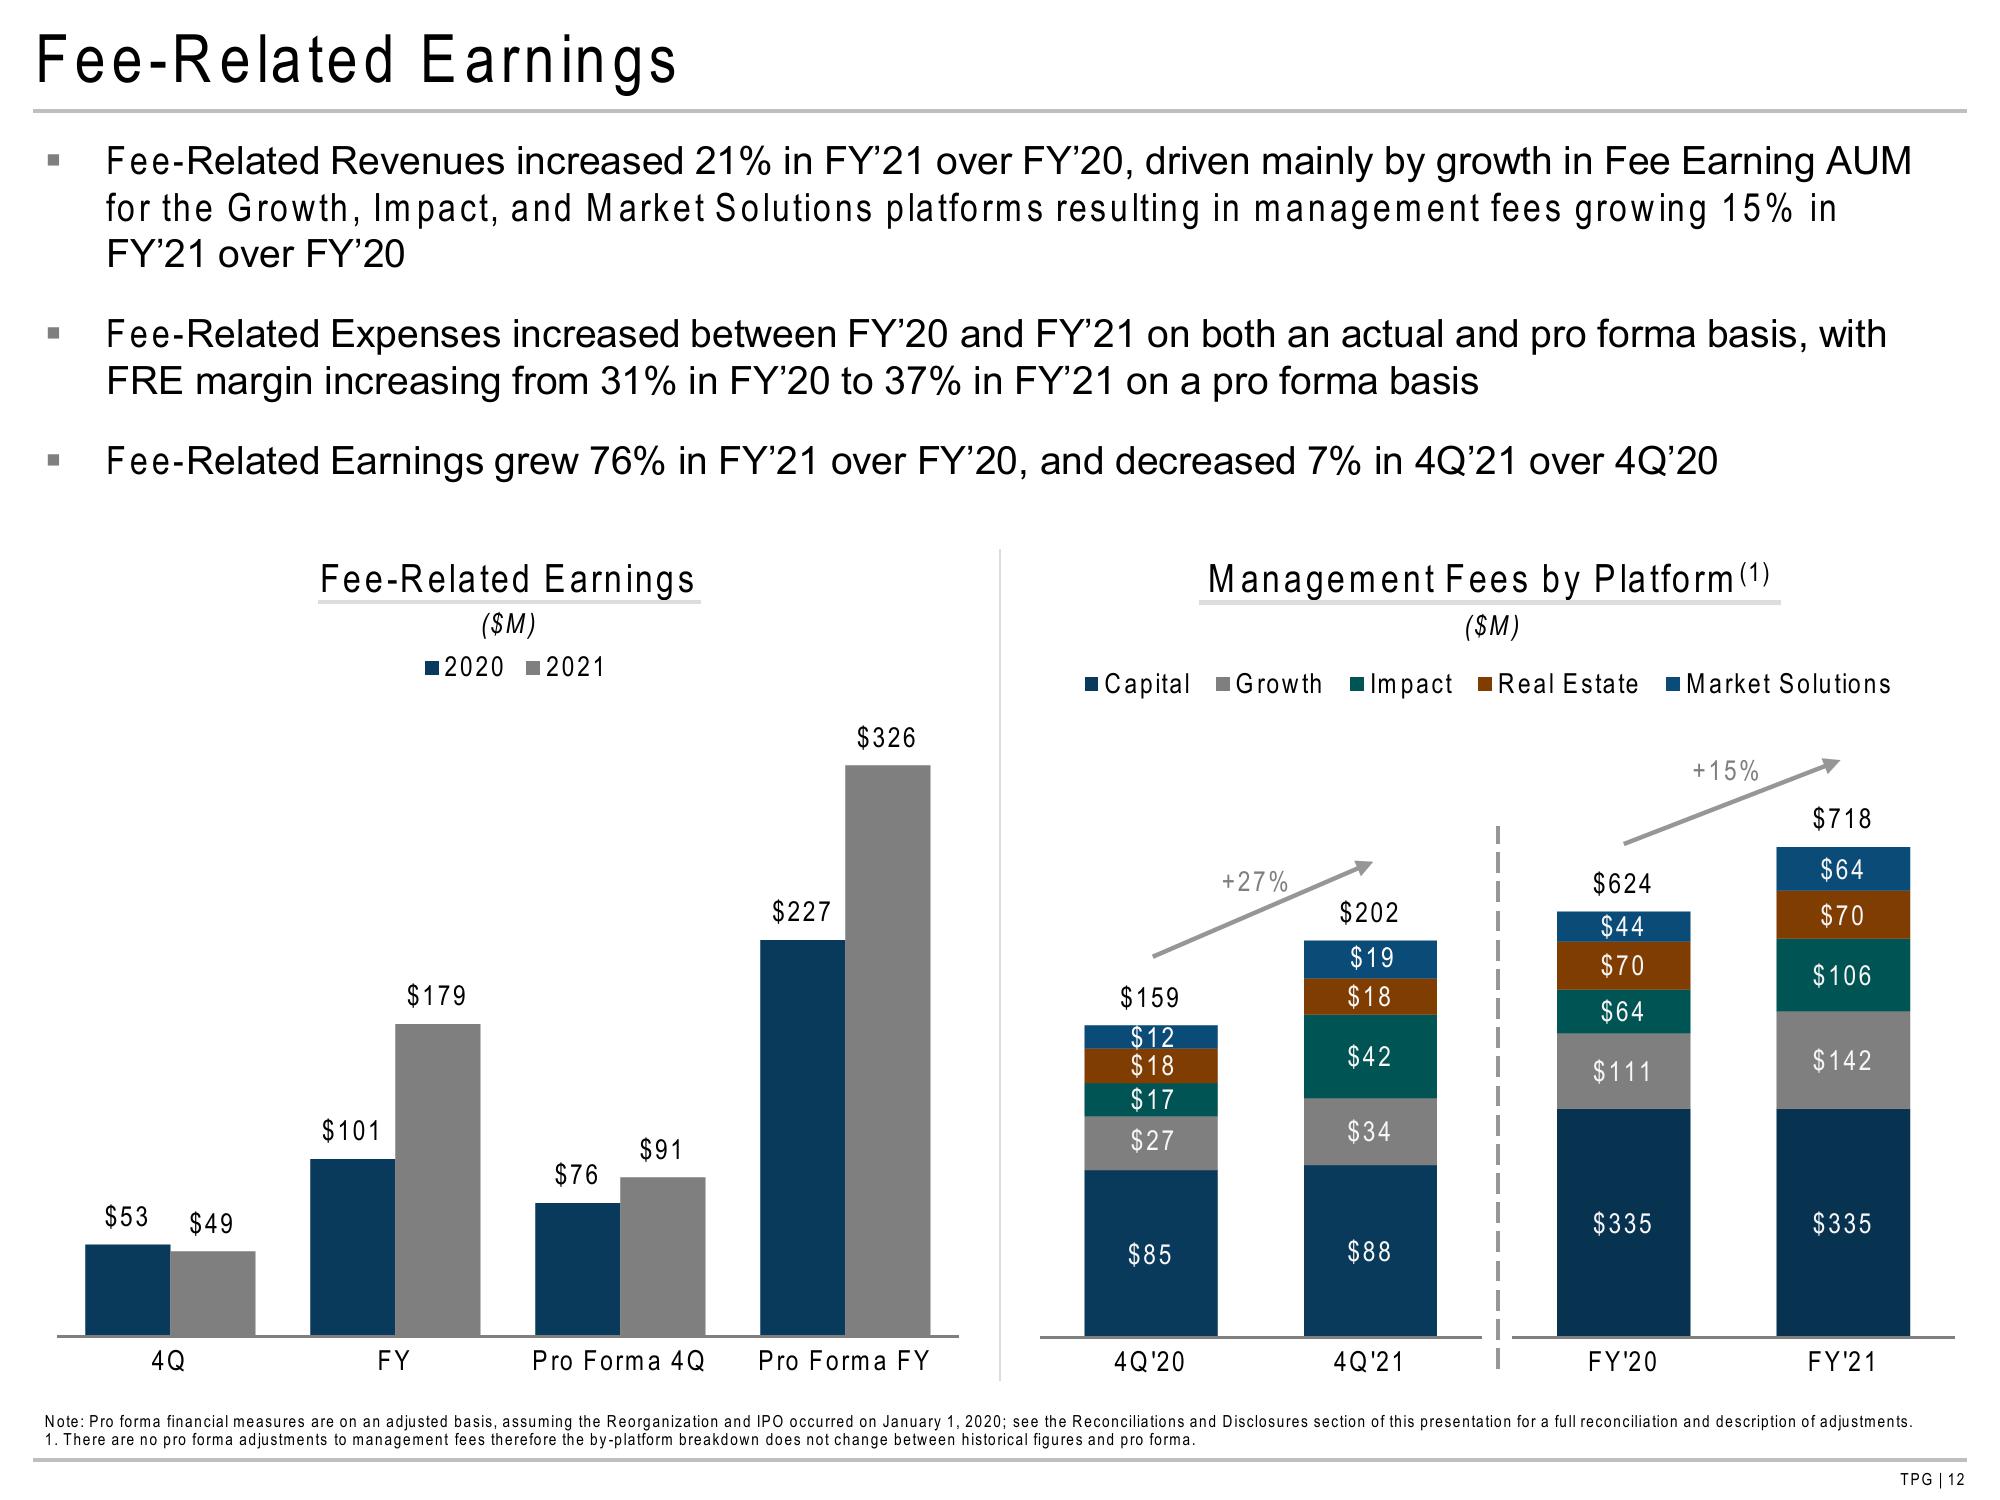
Fee-Related Revenues increased 21% in FY'21 over FY'20, driven mainly by growth in Fee Earning AUM
for the Growth, Impact, and Market Solutions platforms resulting in management fees growing 15% in
FY'21 over FY'20
■
■
Fee-Related Expenses increased between FY'20 and FY'21 on both an actual and pro forma basis, with
FRE margin increasing from 31% in FY'20 to 37% in FY'21 on a pro forma basis
Fee-Related Earnings grew 76% in FY'21 over FY'20, and decreased 7% in 4Q'21 over 4Q'20
$53
4Q
$49
Fee-Related Earnings
$101
($M)
2020 2021
$179
FY
$76
$91
$227
$326
Pro Forma 4Q Pro Forma FY
Management Fees by Platform (1)
($M)
Capital Growth Impact Real Estate Market Solutions
$159
$12
$18
$17
$27
$85
4Q'20
+27%
$202
$19
$18
$42
$34
$88
4Q'21
$624
$44
$70
$64
$111
$335
FY'20
+15%
$718
$64
$70
$106
$142
$335
FY'21
Note: Pro forma financial measures are on an adjusted basis, assuming the Reorganization and IPO occurred on January 1, 2020; see the Reconciliations and Disclosures section of this presentation for a full reconciliation and description of adjustments.
1. There are no pro forma adjustments to management fees therefore the by-platform breakdown does not change between historical figures and pro forma.
TPG | 12View entire presentation