Overstock Results Presentation Deck
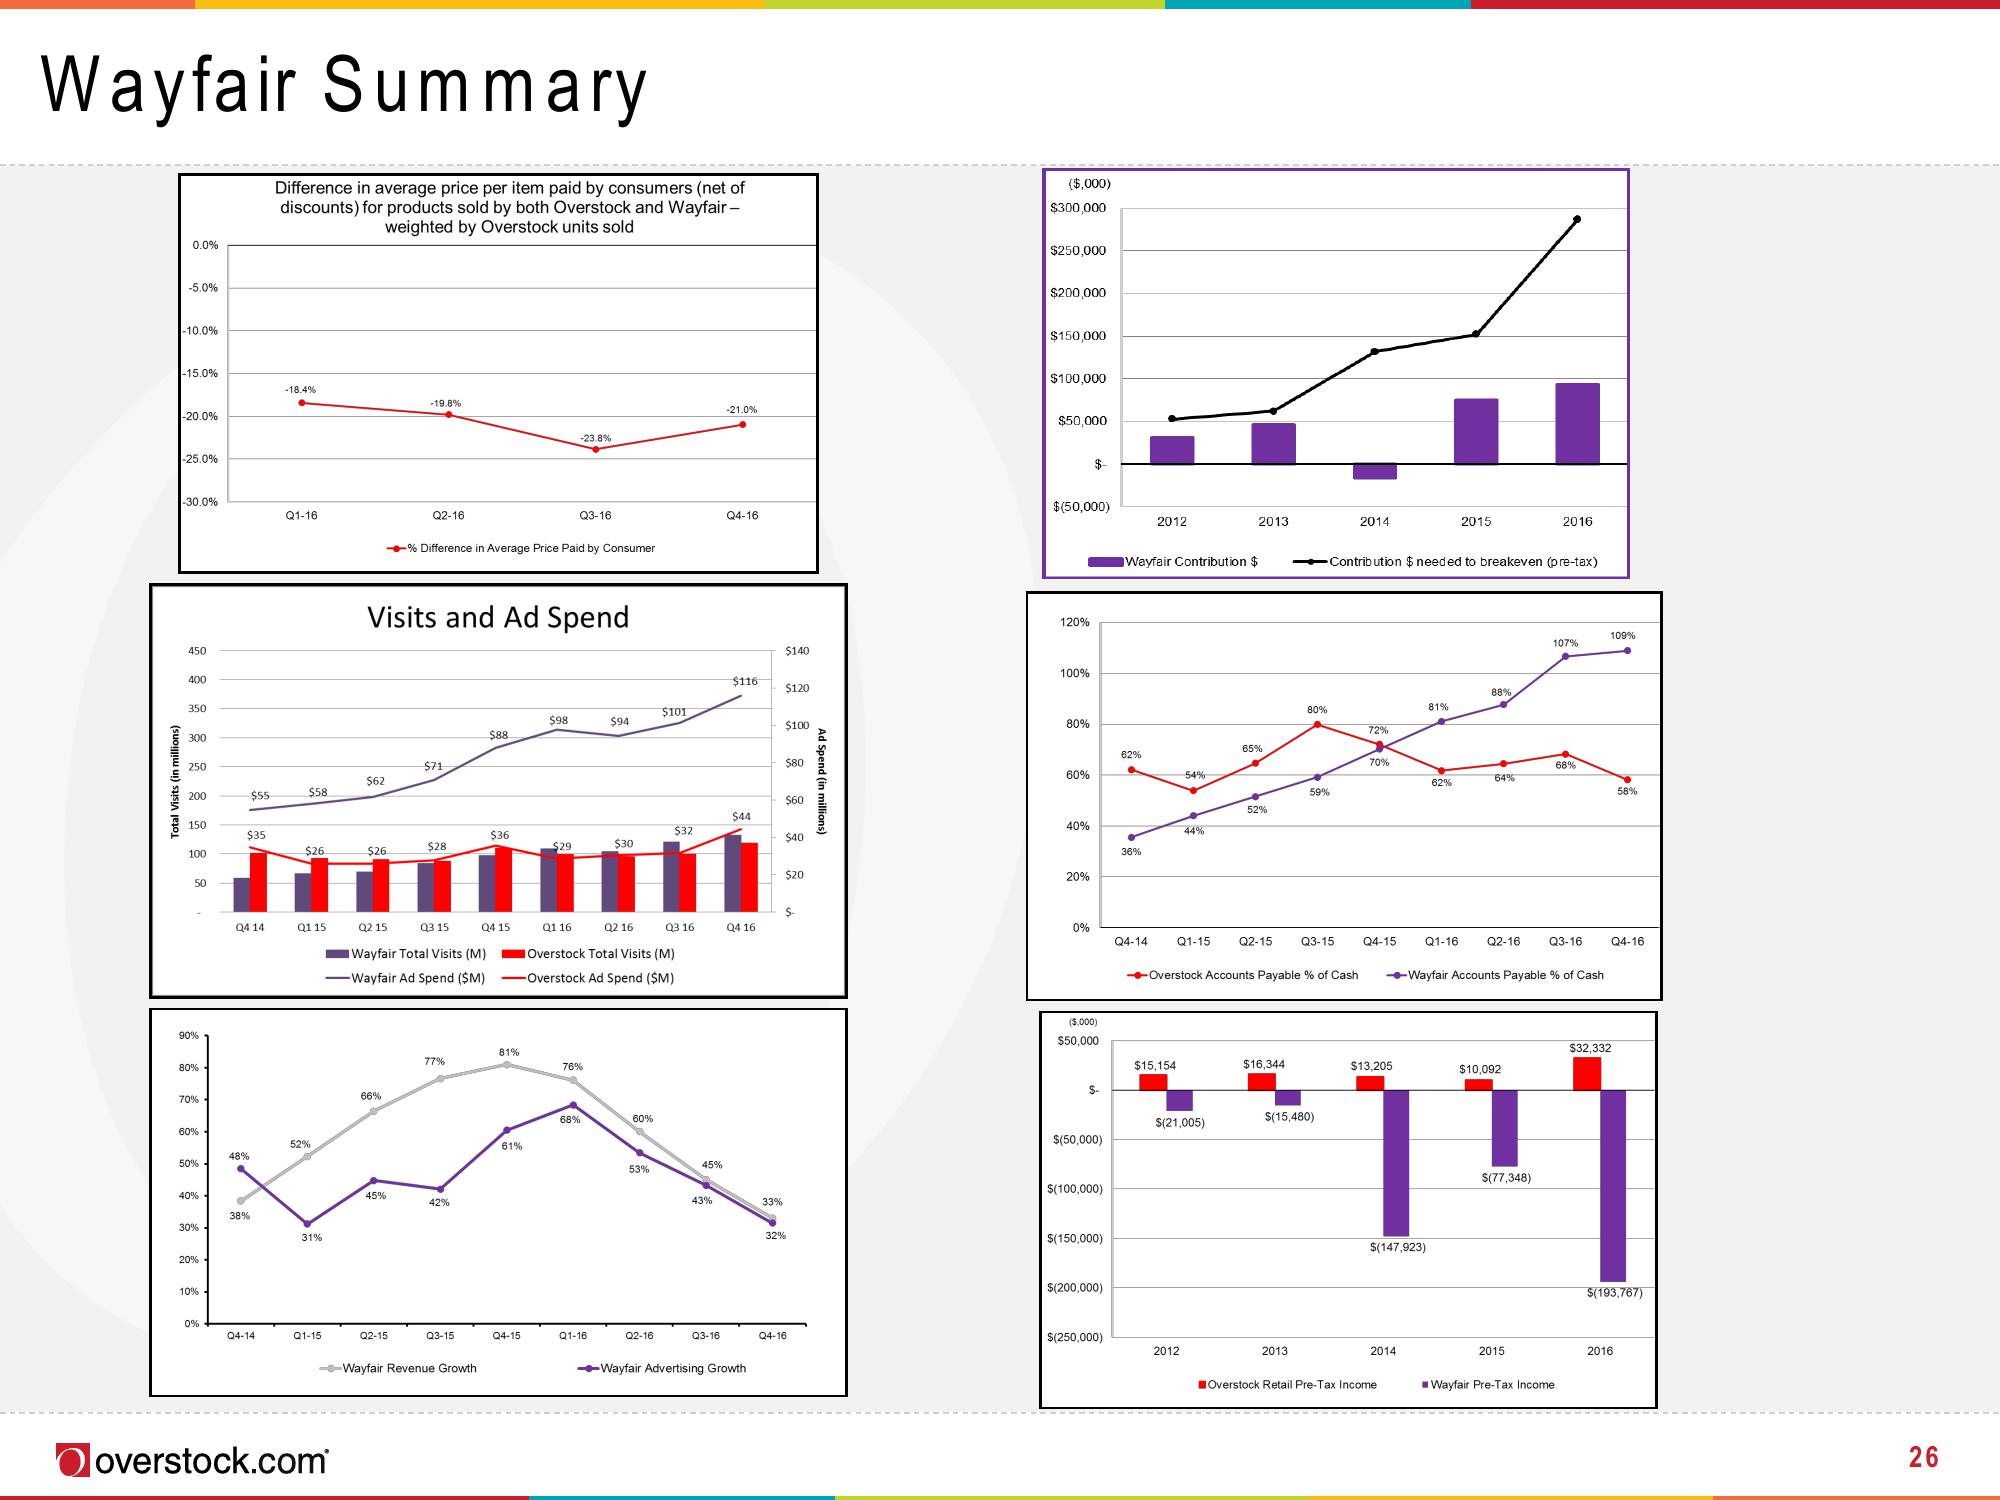
Wayfair Summary
Total Visits (in millions)
0.0%
-5.0%
-10.0%
-15.0%
-20.0%
-25.0%
-30.0%
450
400
350
300
250
200
150
100
50
90%
80%
70%
60%
50%
40%
30%
20%
10%
0%
48%
$55
38%
Difference in average price per item paid by consumers (net of
discounts) for products sold by both Overstock and Wayfair -
weighted by Overstock units sold
Q4-14
-18.4%
$35
$26
HH
Q4 14
Q1 15
Q1-16
$58
52%
31%
Q1-15
$62
overstock.com
$26
Q2 15
Visits and Ad Spend
66%
-19.8%
→→→% Difference in Average Price Paid by Consumer
Q2-16
45%
Q2-15
$71
Wayfair Total Visits (M)
-Wayfair Ad Spend ($M)
$28
Q3 15
77%
42%
Q3-15
--Wayfair Revenue Growth
$88
$36
04 15
81%
61%
Q4-15
$98
$29
-23.8%
Q3-16
Q1 16
76%
68%
$94
Q1-16
$30
Q2 16
Overstock Total Visits (M)
Overstock Ad Spend ($M)
60%
53%
$101
Q2-16
$32
Q3 16
45%
43%
Q3-16
-21.0%
Q4-16
$116
$44
Q4 16
--Wayfair Advertising Growth
33%
32%
$140
$120
$100
$80
$60
$40
$20
Q4-16
$-
Ad Spend (in millions)
($,000)
$300,000
$250,000
$200,000
$150,000
$100,000
$50,000
$(50,000)
120%
100%
80%
60%
40%
20%
$
0%
($,000)
$50,000
$
$(50,000)
$(100,000)
$(150,000)
$(200,000)
$(250,000)
Wayfair Contribution $
62%
36%
2012
Q4-14
54%
Q1-15
$15,154
44%
2012
$(21,005)
2013
65%
52%
Q2-15
→→-Overstock Accounts Payable % of Cash
$16,344
80%
2013
59%
-Contribution $ needed to breakeven (pre-tax)
Q3-15
$(15,480)
2014
72%
70%
$13,205
$(147,923)
81%
2014
Overstock Retail Pre-Tax Income
2015
62%
Q4-15 Q1-16 Q2-16
88%
64%
-Wayfair Accounts Payable % of Cash
$10,092
$(77,348)
2016
2015
107%
68%
Q3-16
■Wayfair Pre-Tax Income
109%
Q4-16
$32,332
58%
$(193,767)
2016
26View entire presentation