Marten Transport Results Presentation Deck
PL
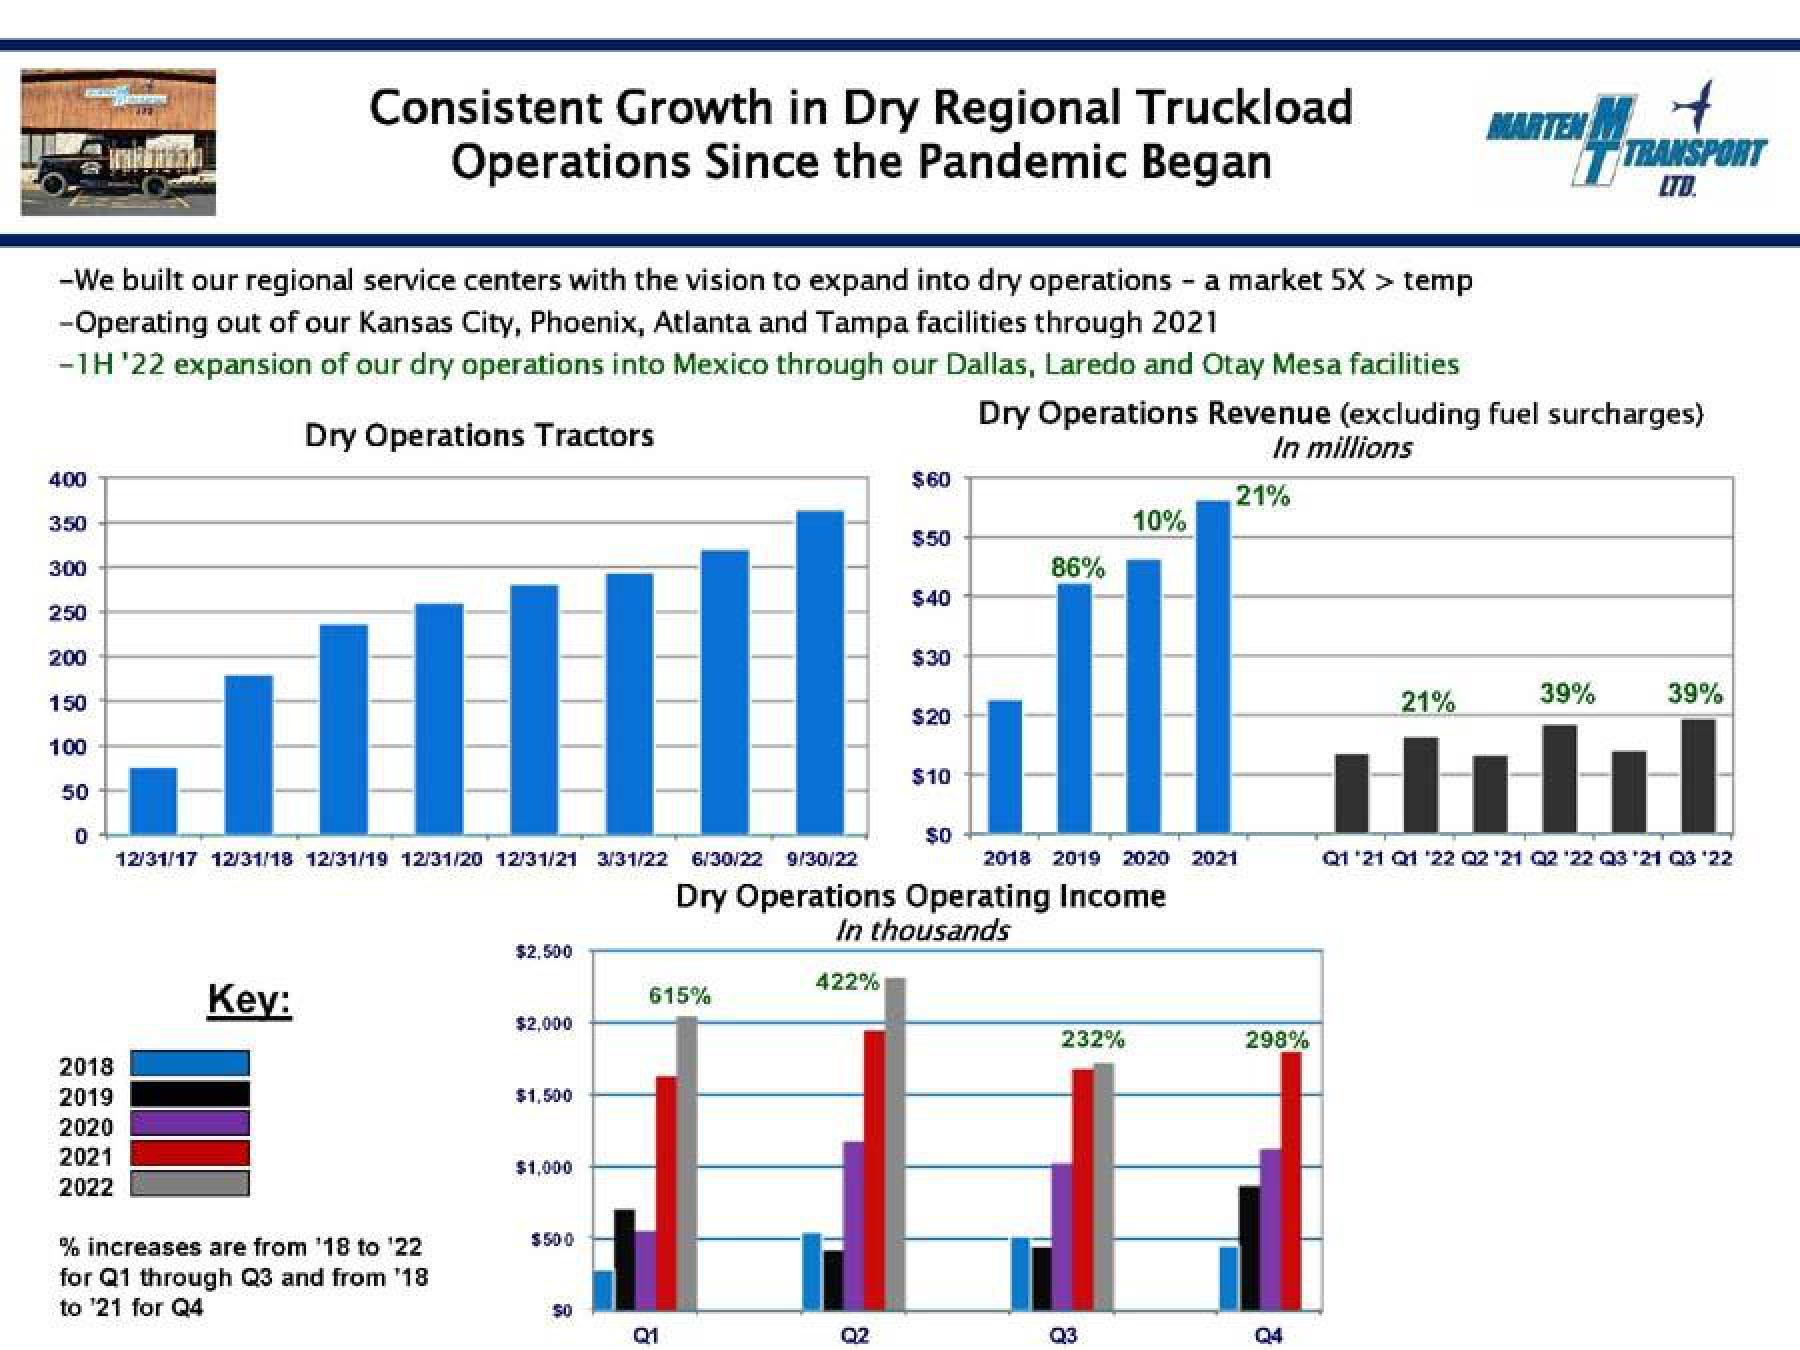
-We built our regional service centers with the vision to expand into dry operations - a market 5X > temp
-Operating out of our Kansas City, Phoenix, Atlanta and Tampa facilities through 2021
-1H '22 expansion of our dry operations into Mexico through our Dallas, Laredo and Otay Mesa facilities
Dry Operations Tractors
400
350
3:00
250
200
150
100
50
0
2018
2019
2020
2021
2022
Consistent Growth in Dry Regional Truckload
Operations Since the Pandemic Began
12/31/17 12/31/18 12/31/19 12/31/20 12/31/21 3/31/22 6/30/22 9/30/22
Key:
% increases are from '18 to ¹22
for Q1 through Q3 and from '18
to '21 for Q4
$2,500
$2,000
$1,500
$1,000
$500
$0
615%
Q1
422%
$60
02
$50
$40
$30
$20
$10
$0
86%
Dry Operations Operating Income
In thousands
Dry Operations Revenue (excluding fuel surcharges)
In millions
21%
2018 2019 2020 2021
10%
232%
Q3
298%
2
04
MARTEN M
TRANSPORT
LTD.
21%
39%
Holl
Q1 '21 Q1 '22 02 ¹21 Q2 '22 Q3 '21 Q3 '22
39%View entire presentation