Netstreit Investor Presentation Deck
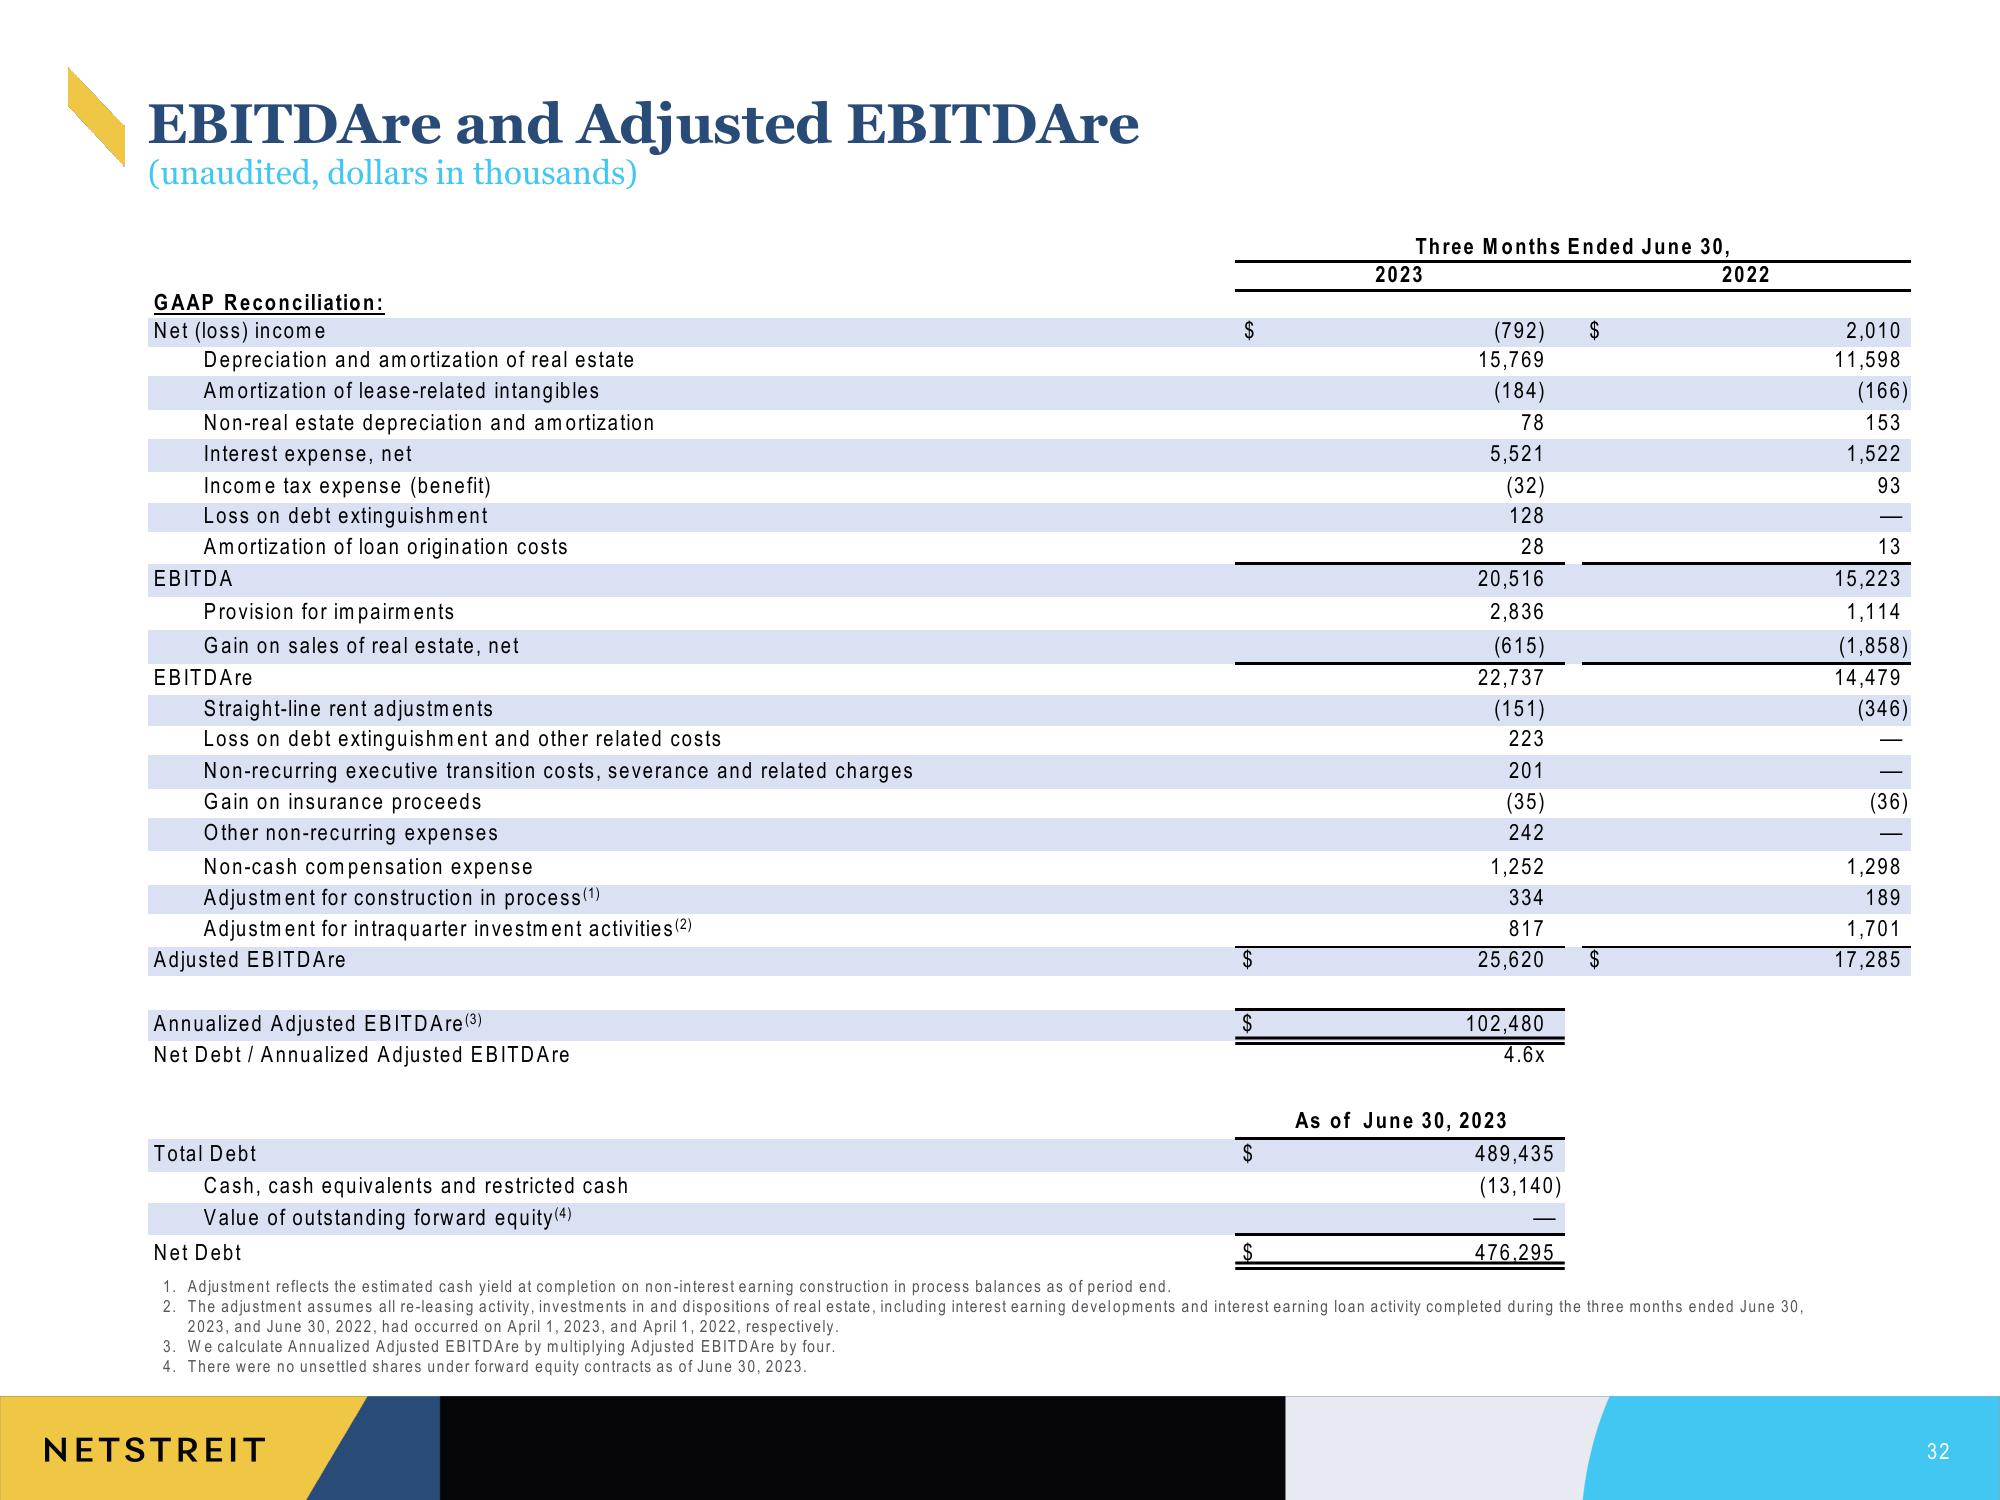
EBITDAre and Adjusted EBITDAre
(unaudited, dollars in thousands)
GAAP Reconciliation:
Net (loss) income
Depreciation and amortization of real estate
Amortization of lease-related intangibles
Non-real estate depreciation and amortization
Interest expense, net
Income tax expense (benefit)
Loss on debt extinguishment
Amortization of loan origination costs
EBITDA
Provision for impairments
Gain on sales of real estate, net
EBITDAre
Straight-line rent adjustments
Loss on debt extinguishment and other related costs
Non-recurring executive transition costs, severance and related charges
Gain on insurance proceeds
Other non-recurring expenses
Non-cash compensation expense
Adjustment for construction in process (¹)
Adjustment for intraquarter investment activities (2)
Adjusted EBITDAre
Annualized Adjusted EBITDAre (³)
Net Debt / Annualized Adjusted EBITD Are
Total Debt
Cash, cash equivalents and restricted cash
Value of outstanding forward equity (4)
Net Debt
3. We calculate Annualized Adjusted EBITDAre by multiplying Adjusted EBITDAre by four.
4. There were no unsettled shares under forward equity contracts as of June 30, 2023.
$
NETSTREIT
$
$
$
Three Months Ended June 30,
2023
(792)
15,769
(184)
78
5,521
(32)
128
28
20,516
2,836
(615)
22,737
(151)
223
201
(35)
242
1,252
334
817
25,620
102,480
4.6x
As of June 30, 2023
489,435
(13,140)
476.295
$
$
1. Adjustment reflects the estimated cash yield at completion on non-interest earning construction in process balances as of period end.
2. The adjustment assumes all re-leasing activity, investments in and dispositions of real estate, including interest earning developments and interest earning loan activity completed during the three months ended June 30,
2023, and June 30, 2022, had occurred on April 1, 2023, and April 1, 2022, respectively.
2022
2,010
11,598
(166)
153
1,522
93
13
15,223
1,114
(1,858)
14,479
(346)
(36)
1,298
189
1,701
17,285
32View entire presentation