Rally SPAC Presentation Deck
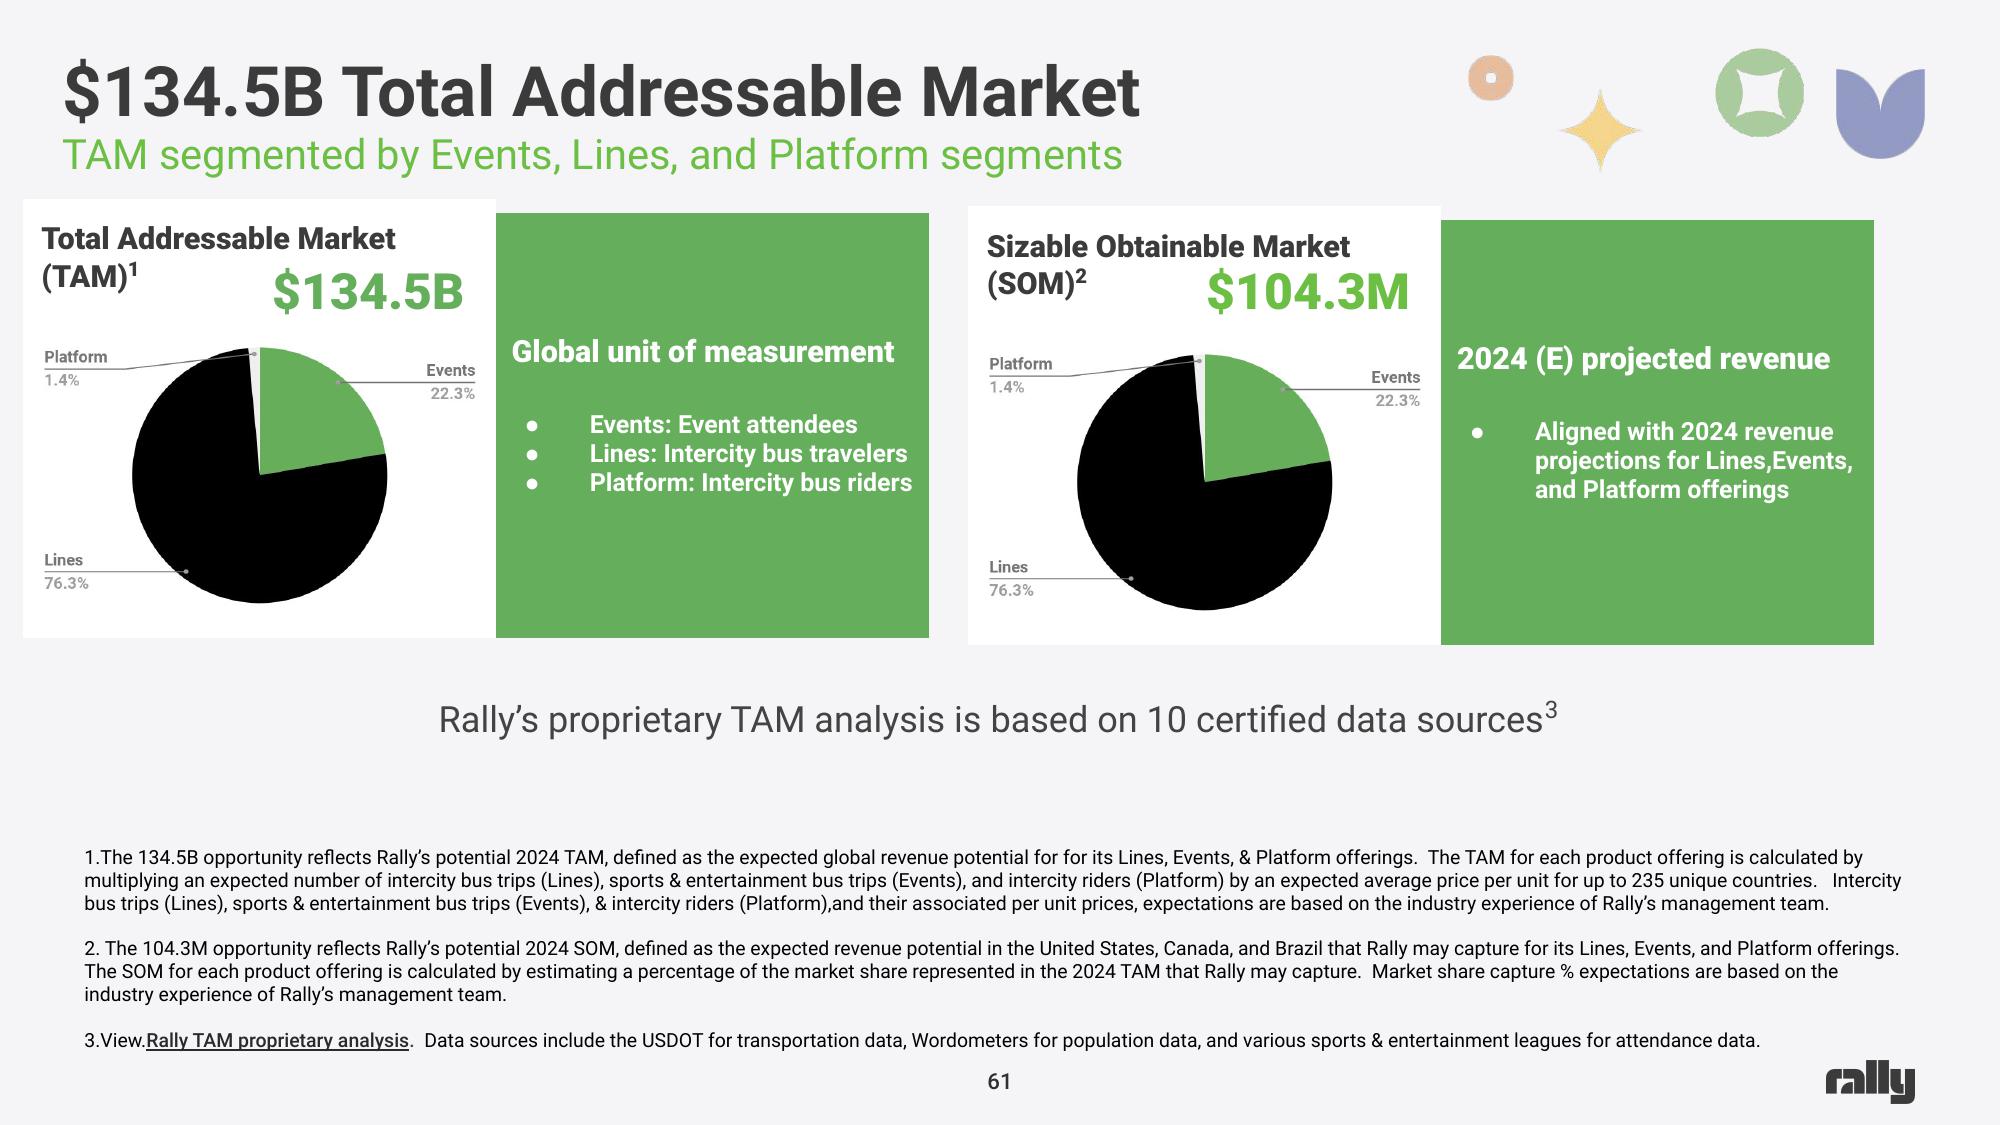
$134.5B Total Addressable Market
TAM segmented by Events, Lines, and Platform segments
Total Addressable Market
(TAM)¹
Platform
1.4%
Lines
76.3%
$134.5B
Events
22.3%
Global unit of measurement
Events: Event attendees
Lines: Intercity bus travelers
Platform: Intercity bus riders
Sizable Obtainable Market
(SOM)²
Platform
1.4%
Lines
76.3%
$104.3M
Events
22.3%
2024 (E) projected revenue
Aligned with 2024 revenue
projecti for Lines, Events,
and Platform offerings
Rally's proprietary TAM analysis is based on 10 certified data sources³
1.The 134.5B opportunity reflects Rally's potential 2024 TAM, defined as the expected global revenue potential for for its Lines, Events, & Platform offerings. The TAM for each product offering is calculated by
multiplying an expected number of intercity bus trips (Lines), sports & entertainment bus trips (Events), and intercity riders (Platform) by an expected average price per unit for up to 235 unique countries. Intercity
bus trips (Lines), sports & entertainment bus trips (Events), & intercity riders (Platform), and their associated per unit prices, expectations are based on the industry experience of Rally's management team.
2. The 104.3M opportunity reflects Rally's potential 2024 SOM, defined as the expected revenue potential in the United States, Canada, and Brazil that Rally may capture for its Lines, Events, and Platform offerings.
The SOM for each product offering is calculated by estimating a percentage of the market share represented in the 2024 TAM that Rally may capture. Market share capture % expectations are based on the
industry experience of Rally's management team.
3.View.Rally TAM proprietary analysis. Data sources include the USDOT for transportation data, Wordometers for population data, and various sports & entertainment leagues for attendance data.
61
rallyView entire presentation