Inovalon Results Presentation Deck
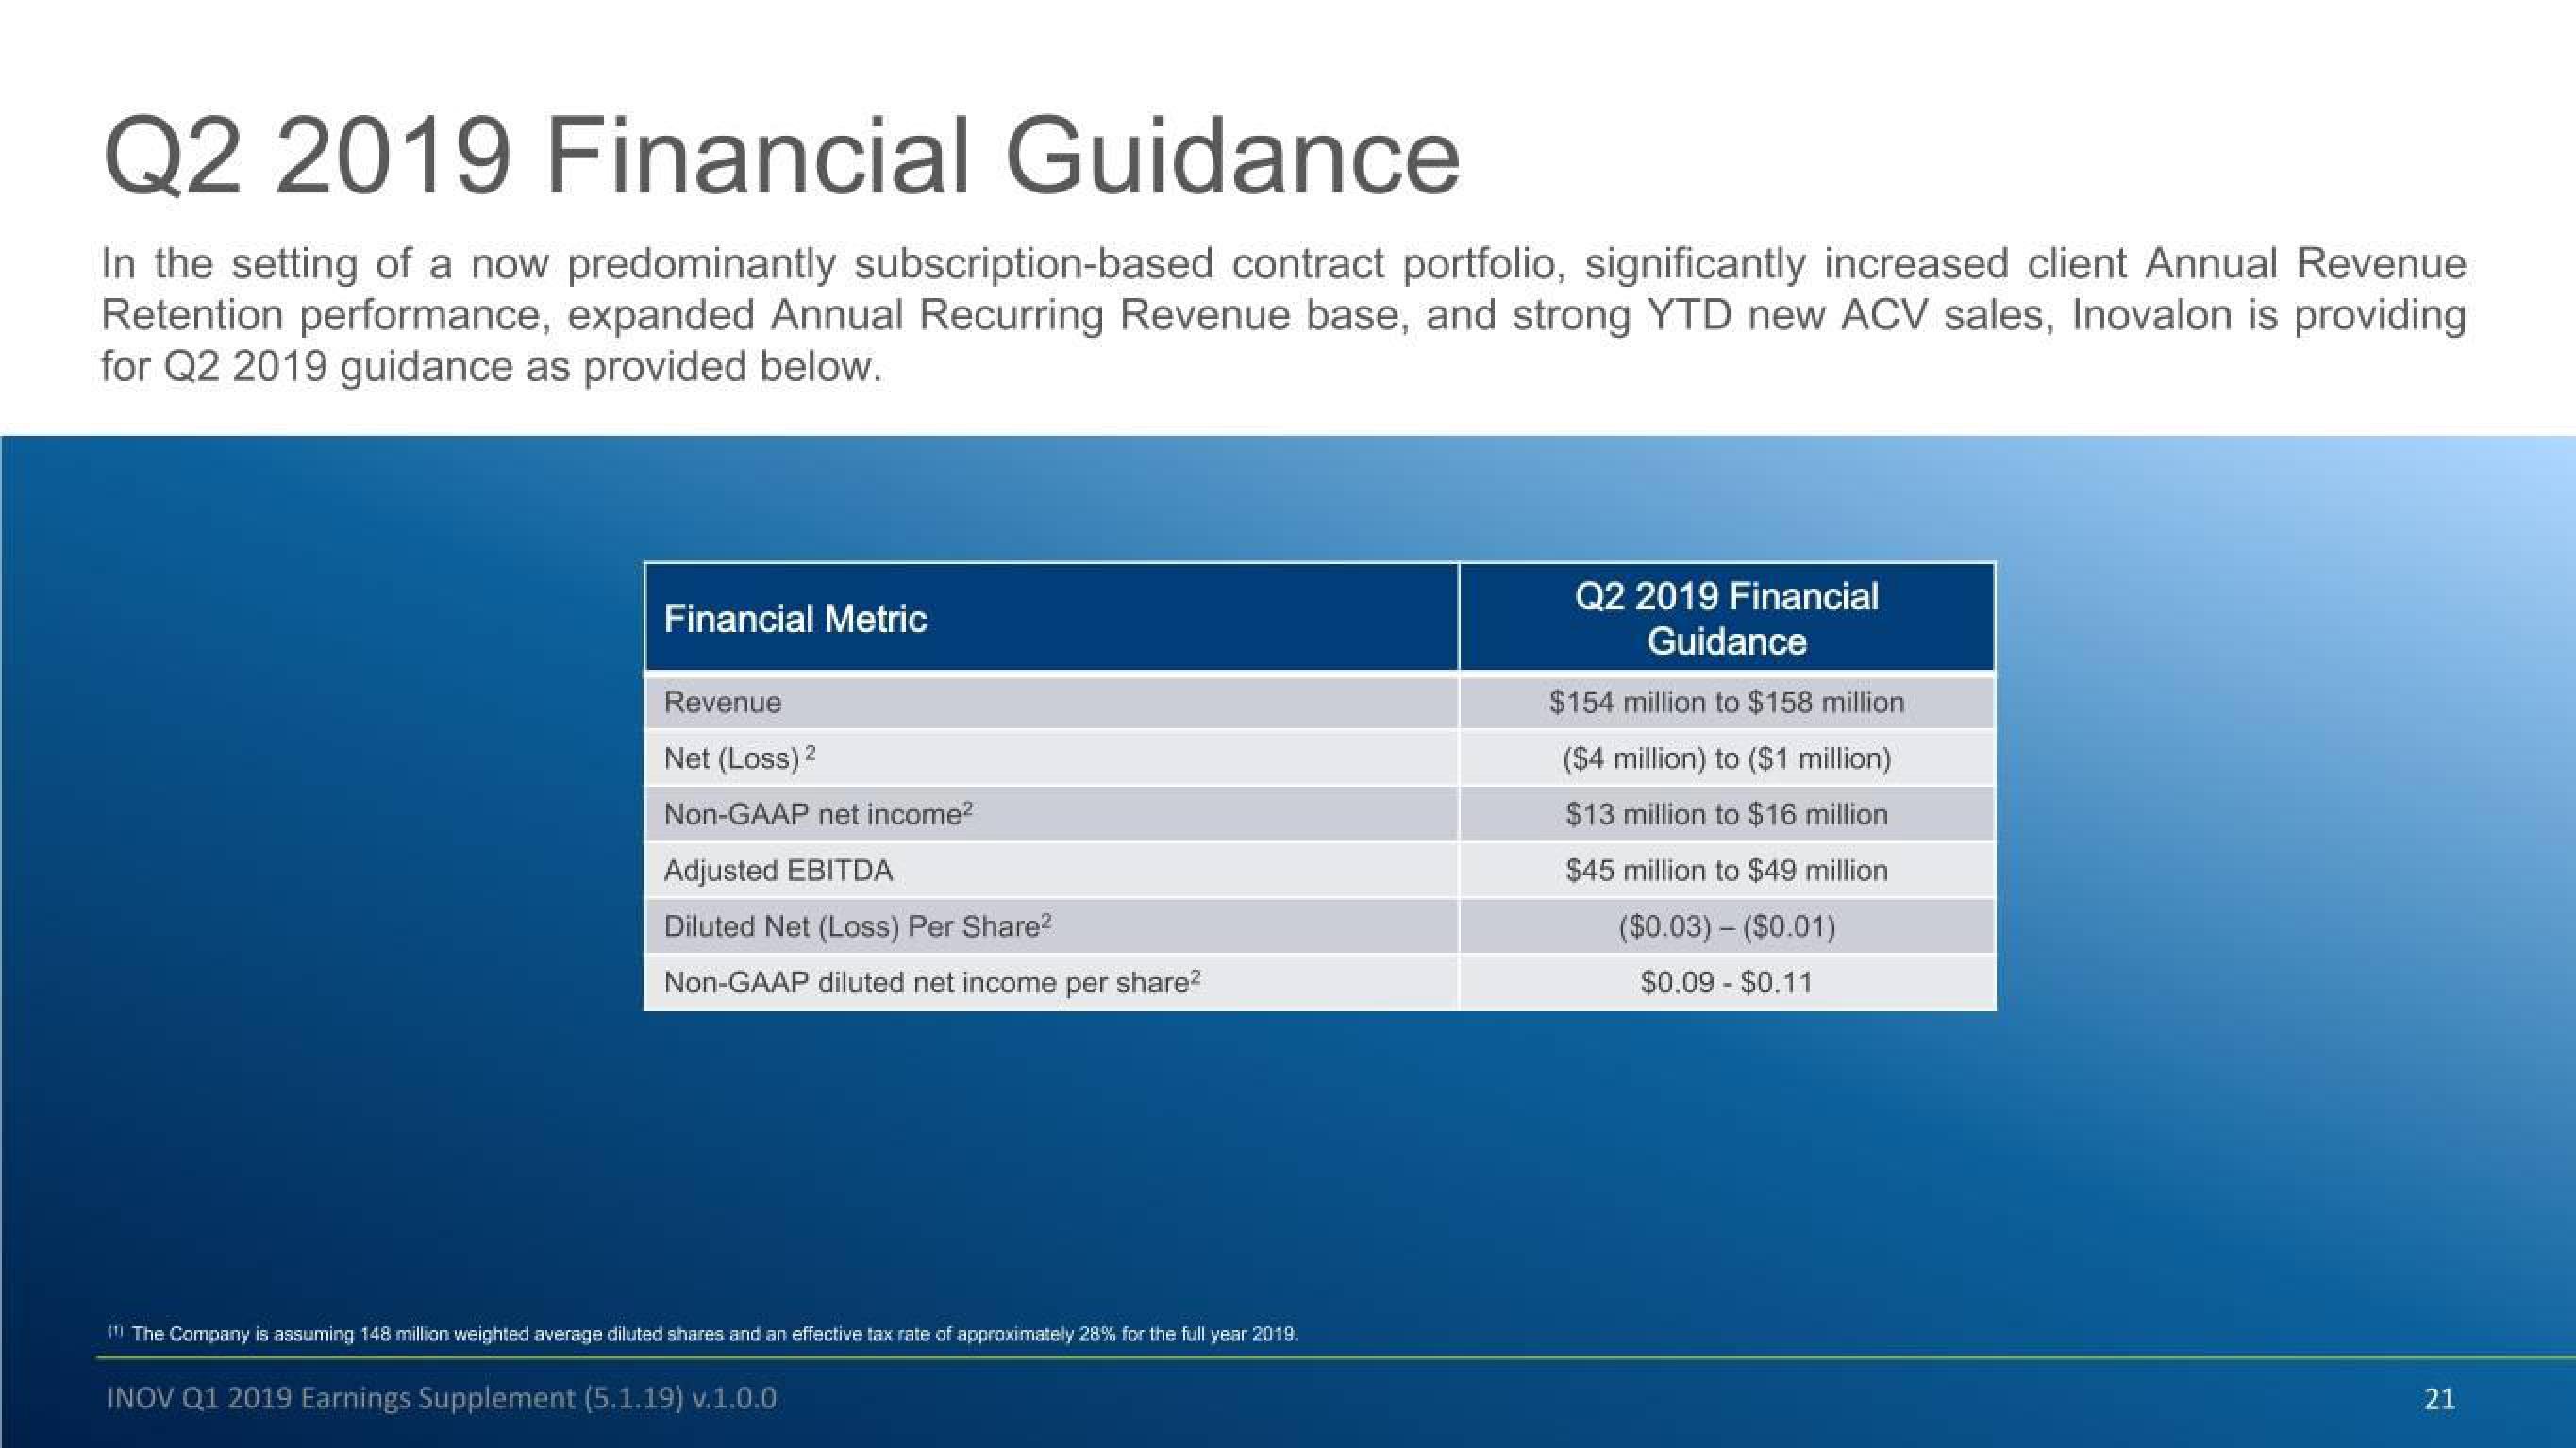
Q2 2019 Financial Guidance
In the setting of a now predominantly subscription-based contract portfolio, significantly increased client Annual Revenue
Retention performance, expanded Annual Recurring Revenue base, and strong YTD new ACV sales, Inovalon is providing
for Q2 2019 guidance as provided below.
Financial Metric
Revenue
Net (Loss) ²
Non-GAAP net income²
Adjusted EBITDA
Diluted Net (Loss) Per Share²
Non-GAAP diluted net income per share²
(1) The Company is assuming 148 million weighted average diluted shares and an effective tax rate of approximately 28% for the full year 2019.
INOV Q1 2019 Earnings Supplement (5.1.19) v.1.0.0
Q2 2019 Financial
Guidance
$154 million to $158 million
($4 million) to ($1 million)
$13 million to $16 million
$45 million to $49 million
($0.03) - ($0.01)
$0.09 - $0.11
21View entire presentation