Kinnevik Results Presentation Deck
Intro
Net Asset Value
A VOLATILE YET STABLE START TO 2023
Comparing levels at the end of Q1 2023 to the end of 2022, public
equity markets seem to have been stable and positive. Thereinbetween,
however, volatility remained high with continued market jitters to ma-
croeconomic indicators and fears of instability in the banking system.
Broader market indices appreciated by 15-20 percent, largely driven
by the large tech giants. The weighted-average share price increase
in our unlisted portfolio's peer universe was just over 10 percent when
excluding buyouts, compared to a 2 percent weighted-average write-up
of our underlying valuations.
We saw positive movements in our value-based care benchmarks,
noting however that the number of comparable businesses is shrinking
drastically through buyouts, and stable movements in our software and
virtual care benchmarks. On average, the weighted-average peer multiple
expanded by 16 percent (less than 10 percent when excluding buyouts),
compared to 1 percent multiple expansion in our unlisted portfolio.
We revised our expectations on 2023 quite materially in the last quarter,
with our investees deprioritizing growth in favor of longer cash runways
and financial strength. In the first quarter, our 2023 revenue estimates
have been revised downwards in low single-digit percentages, driven by
our more consumer-facing businesses expecting a further weakening of
consumer spending. In our B2B businesses, the outlook remained stable.
In aggregate, the NTM revenue outlook for Q2 2023 through Q1 2024 is
5-6 percent higher than last quarter's outlook for the 2023 full-year (or
around 10 percent higher in our B2B businesses).
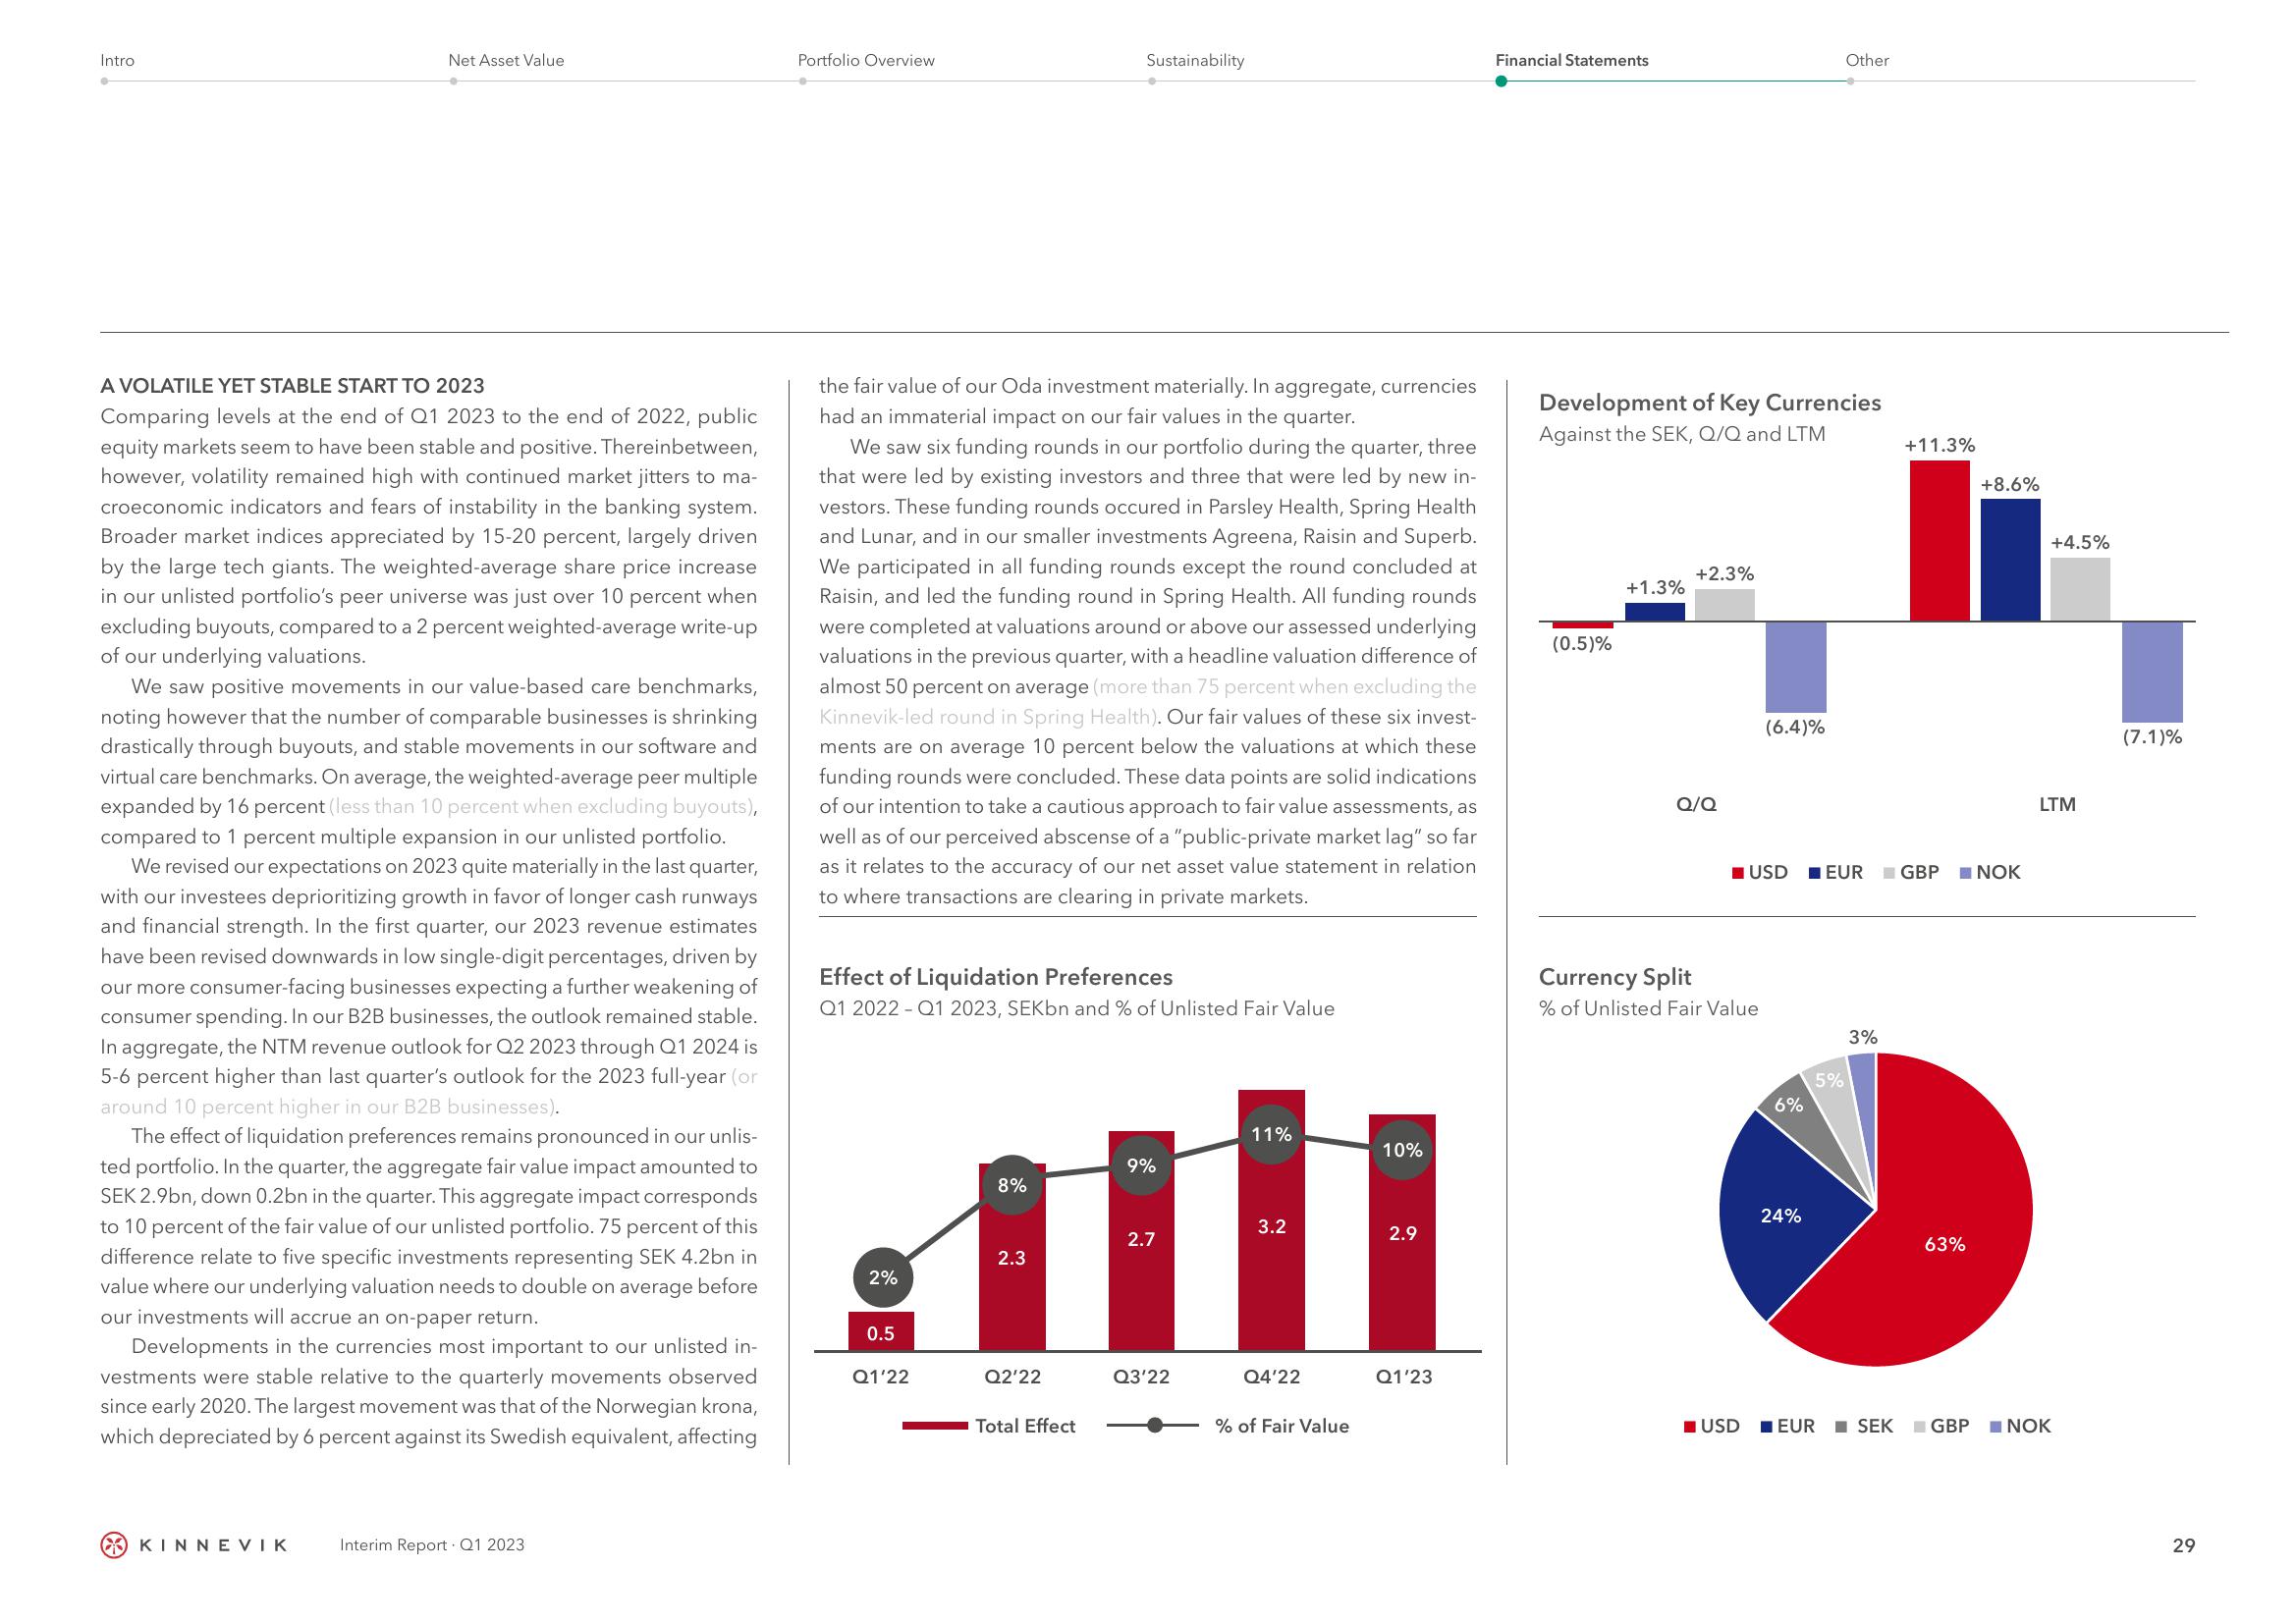
The effect of liquidation preferences remains pronounced in our unlis-
ted portfolio. In the quarter, the aggregate fair value impact amounted to
SEK 2.9bn, down 0.2bn in the quarter. This aggregate impact corresponds
to 10 percent of the fair value of our unlisted portfolio. 75 percent of this
difference relate to five specific investments representing SEK 4.2bn in
value where our underlying valuation needs to double on average before
our investments will accrue an on-paper return.
Developments in the currencies most important to our unlisted in-
vestments were stable relative to the quarterly movements observed
since early 2020. The largest movement was that of the Norwegian krona,
which depreciated by 6 percent against its Swedish equivalent, affecting
KINNEVIK
Interim Report Q1 2023
Portfolio Overview
the fair value of our Oda investment materially. In aggregate, currencies
had an immaterial impact on our fair values in the quarter.
We saw six funding rounds in our portfolio during the quarter, three
that were led by existing investors and three that were led by new in-
vestors. These funding rounds occured in Parsley Health, Spring Health
and Lunar, and in our smaller investments Agreena, Raisin and Superb.
We participated in all funding rounds except the round concluded at
Raisin, and led the funding round in Spring Health. All funding rounds
were completed at valuations around or above our assessed underlying
valuations in the previous quarter, with a headline valuation difference of
almost 50 percent on average (more than 75 percent when excluding the
Kinnevik-led round in Spring Health). Our fair values of these six invest-
ments are on average 10 percent below the valuations at which these
funding rounds were concluded. These data points are solid indications
of our intention to take a cautious approach to fair value assessments, as
well as of our perceived abscense of a "public-private market lag" so far
as it relates to the accuracy of our net asset value statement in relation
to where transactions are clearing in private markets.
Effect of Liquidation Preferences
Q1 2022-Q1 2023, SEKbn and % of Unlisted Fair Value
2%
0.5
Q1'22
8%
2.3
Sustainability
Q2'22
Total Effect
9%
2.7
Q3'22
11%
3.2
Q4'22
% of Fair Value
10%
2.9
Q1'23
Financial Statements
Development of Key Currencies
Against the SEK, Q/Q and LTM
(0.5)%
+1.3%
+2.3%
Q/Q
(6.4)%
USD
Currency Split
% of Unlisted Fair Value
6%
24%
Other
5%
EUR GBP
+11.3%
3%
63%
USD EUR SEK GBP
+8.6%
NOK
+4.5%
LTM
NOK
(7.1)%
29View entire presentation