Telia Company Results Presentation Deck
LED MARKETS
780 788 781
Lithuania
Reported currency, in millions, like for like growth
+8.1%
+9.3%
●
Q3 Q4 Q1 Q2 Q3
20 20 21 21 21
Service revenues
●
811 840
380 370 368 370
408
Q3 Q4 Q1 Q2 Q3
20 20 21 21 21
EBITDA
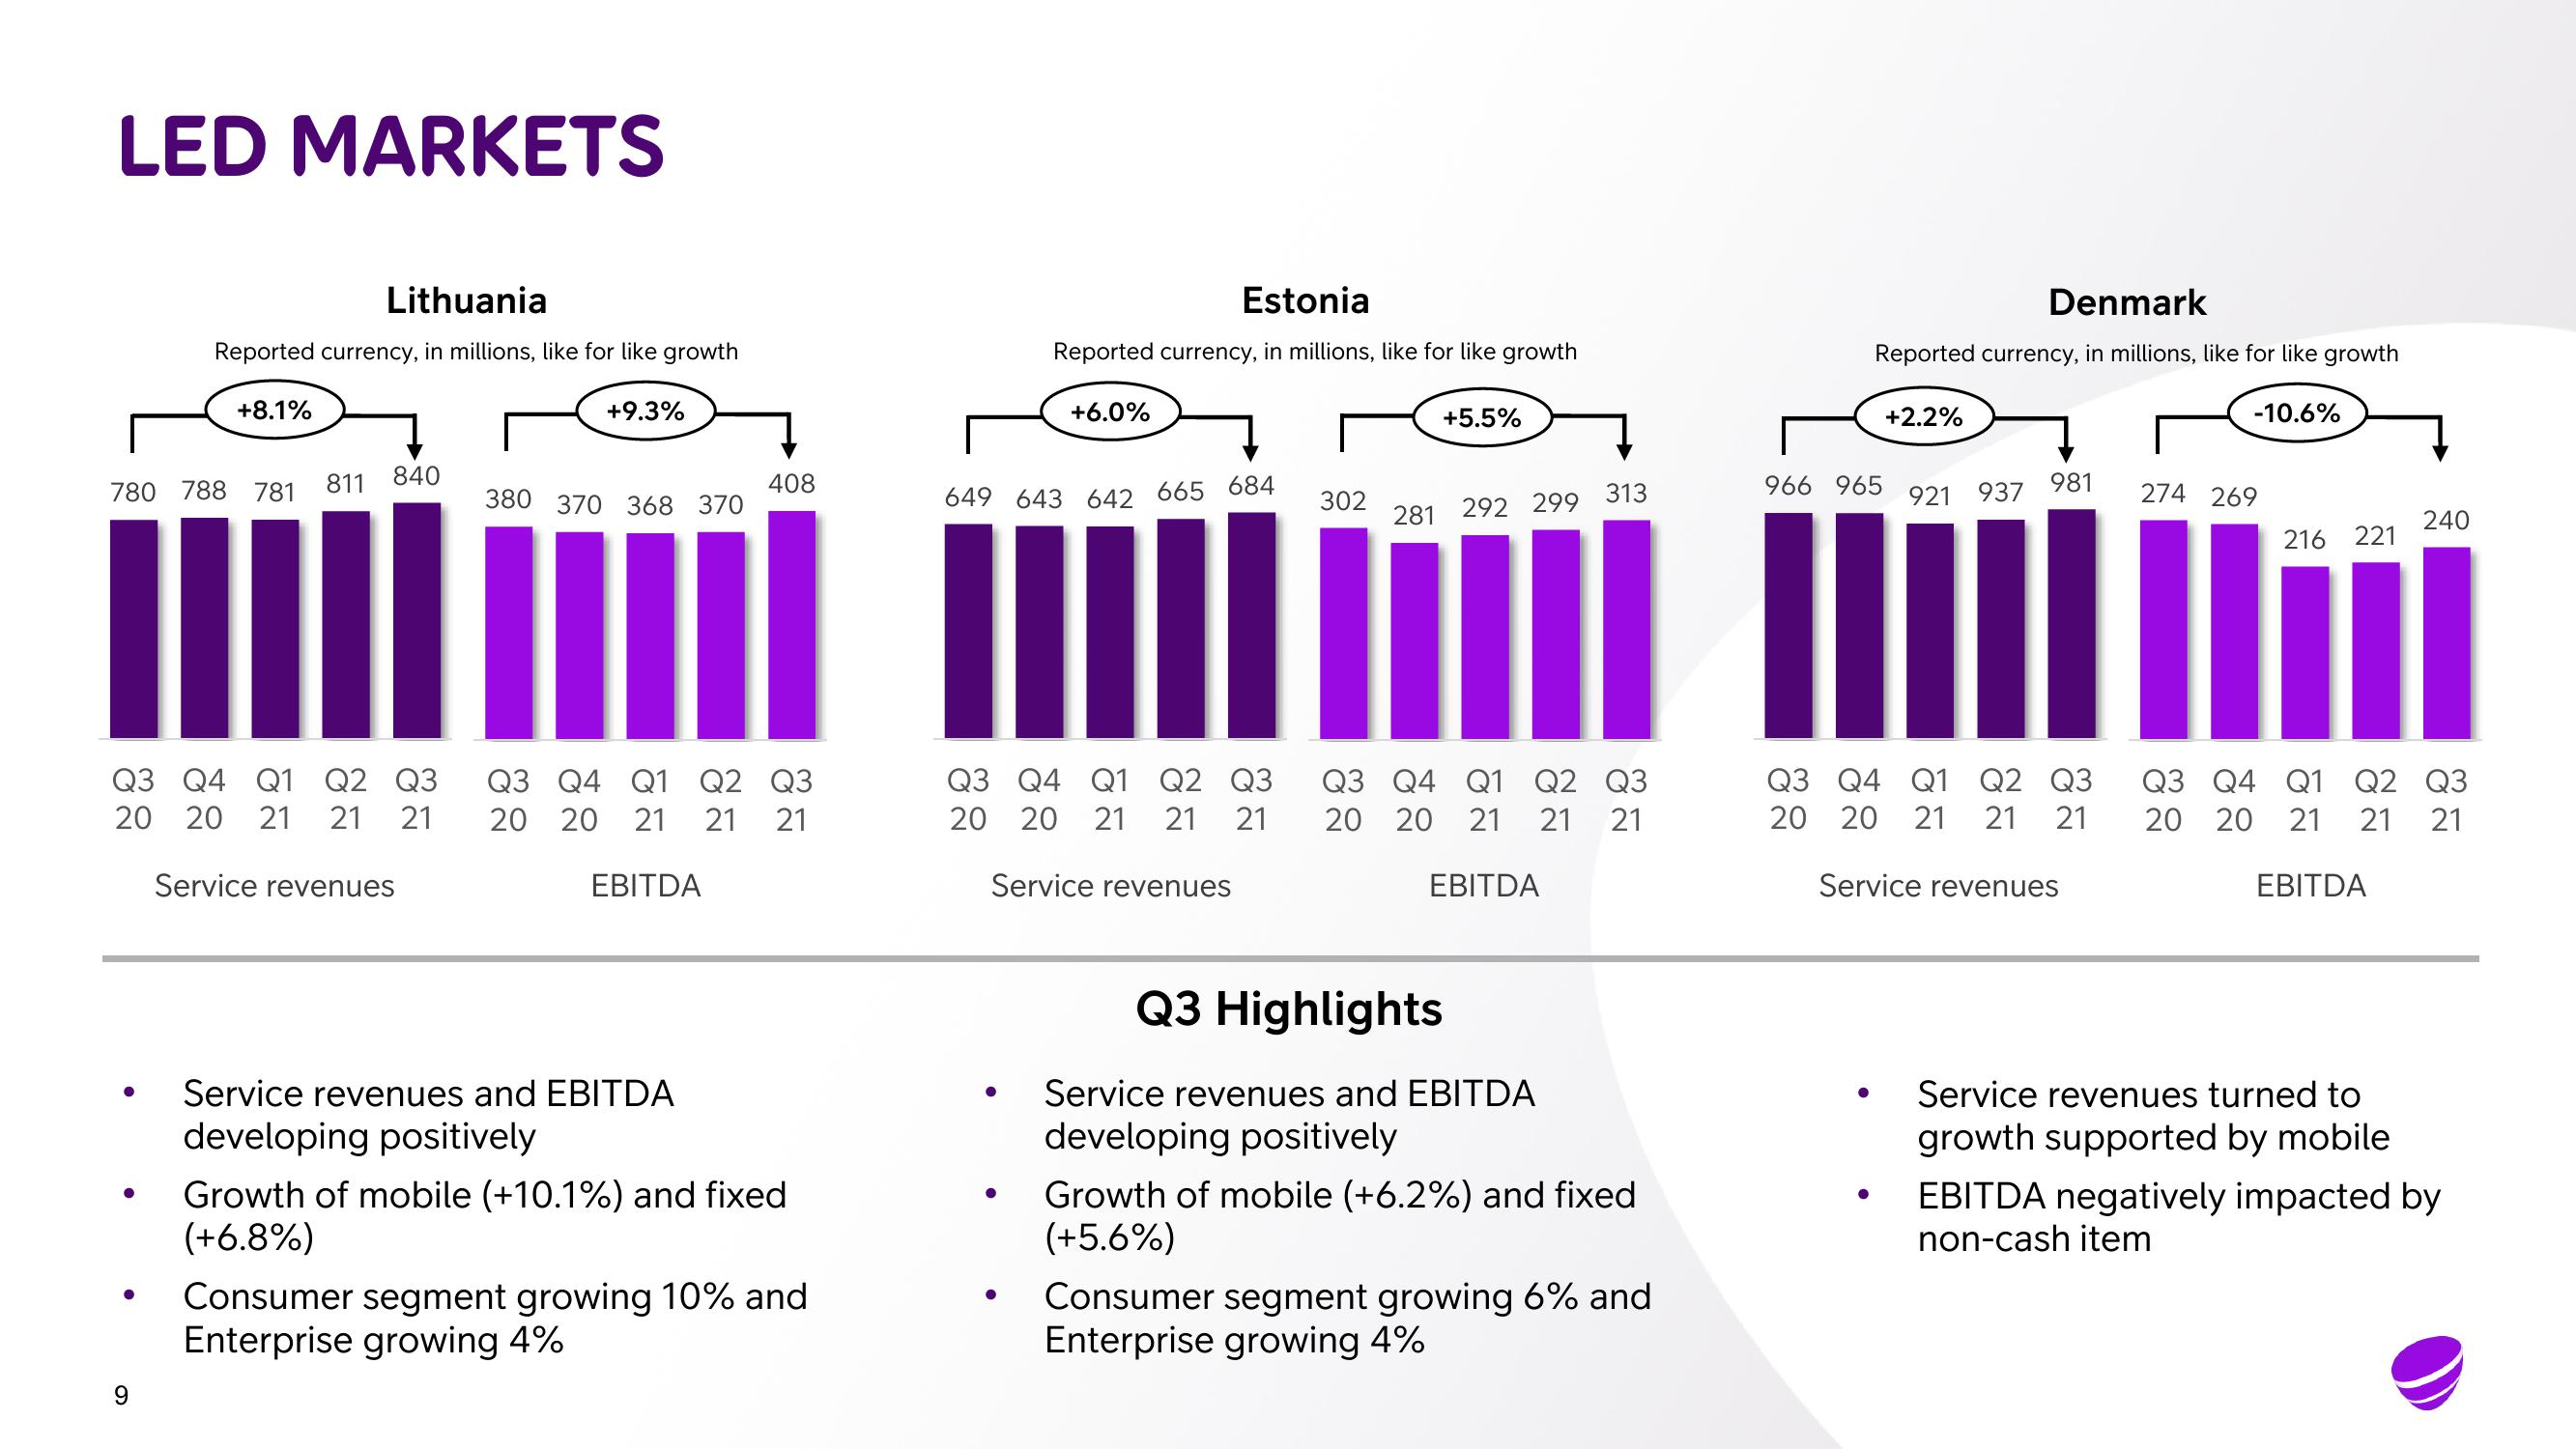
Service revenues and EBITDA
developing positively
Growth of mobile (+10.1%) and fixed
(+6.8%)
Consumer segment growing 10% and
Enterprise growing 4%
Estonia
Reported currency, in millions, like for like growth
+6.0%
649 643 642 665 684
Q3 Q4 Q1 Q2 Q3
20 20 21 21 21
Service revenues
302
281
+5.5%
292 299 313
Q3 Q4 Q1 Q2 Q3
20 20 21 21 21
EBITDA
Q3 Highlights
Service revenues and EBITDA
developing positively
||
Growth of mobile (+6.2%) and fixed
(+5.6%)
Consumer segment growing 6% and
Enterprise growing 4%
Denmark
Reported currency, in millions, like for like growth
-10.6%
966 965
+2.2%
921 937
981
Q3 Q4 Q1 Q2 Q3
20 20 21 21 21
Service revenues
274 269
216 221
240
Q3 Q4 Q1 Q2 Q3
20 20 21 21 21
EBITDA
Service revenues turned to
growth supported by mobile
EBITDA negatively impacted by
non-cash itemView entire presentation