Ford Investor Conference Presentation Deck
U.S. RETAIL SECURITIZATION
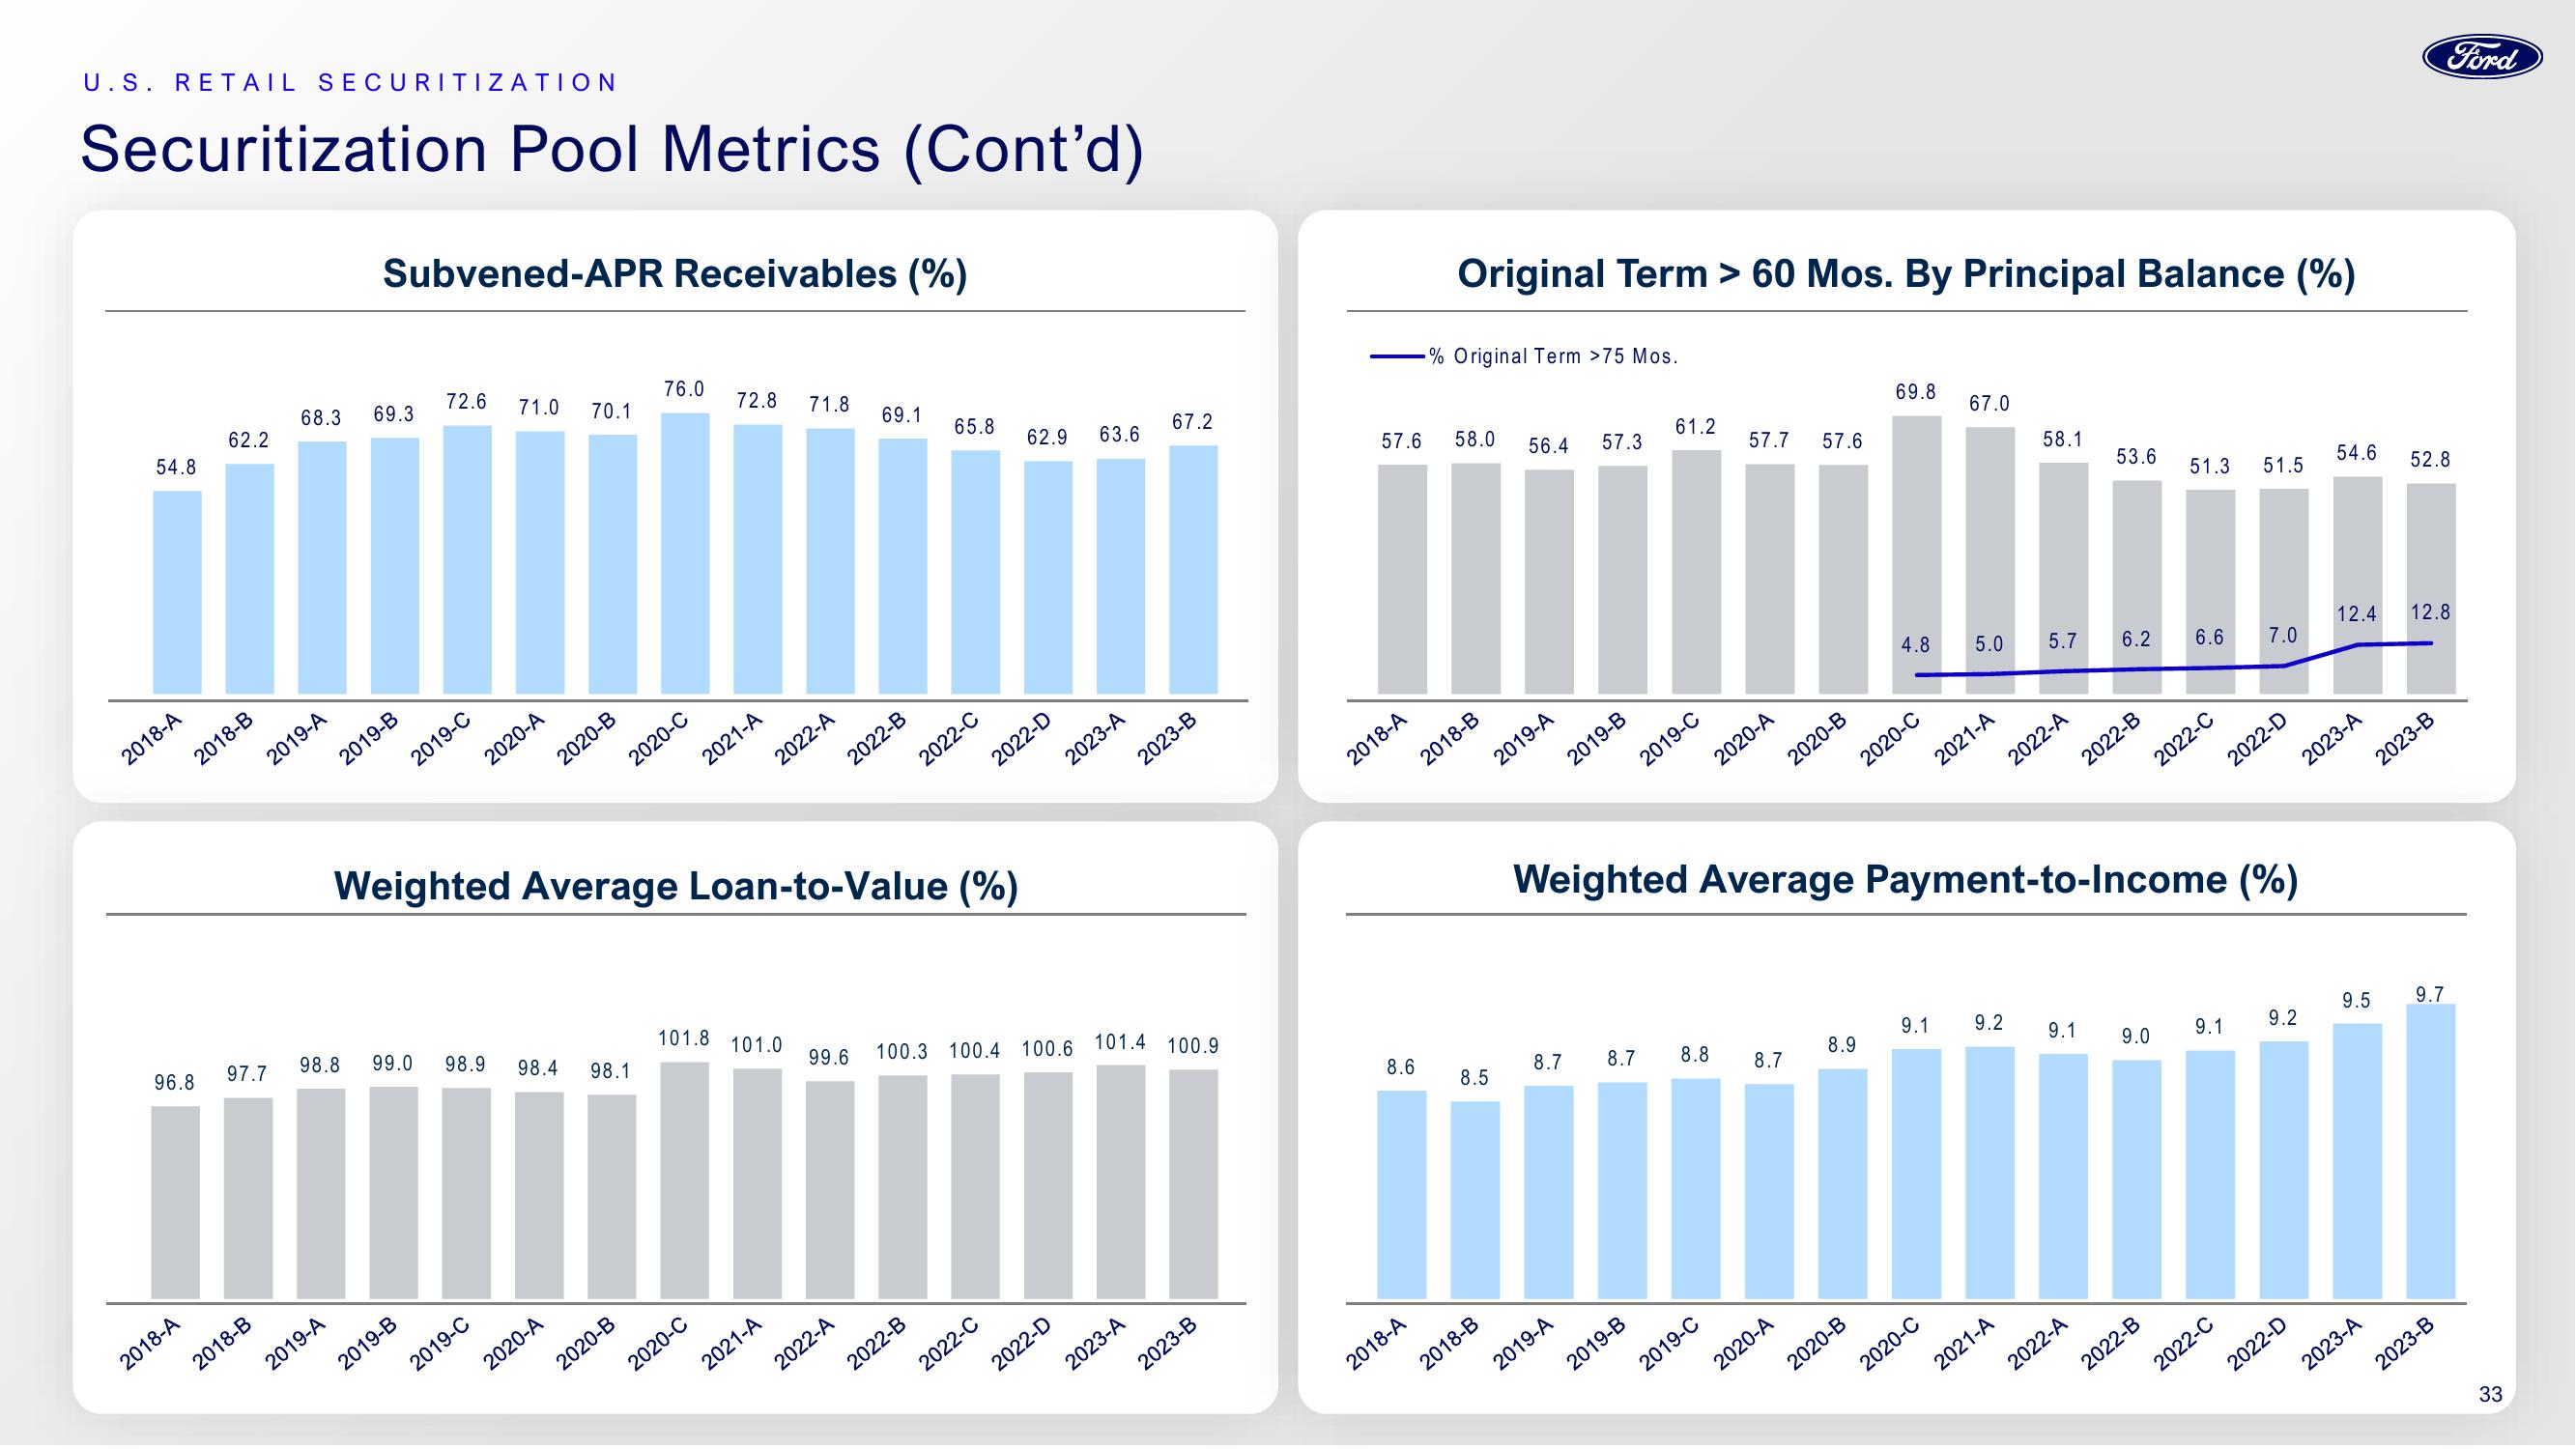
Securitization Pool Metrics (Cont'd)
54.8
2018-A
96.8
2018-A
62.2
2018-B
97.7
2018-B
2019-A
68.3 69.3
Subvened-APR Receivables (%)
2019-A
2019-B
98.8
72.6 71.0
2019-C
99.0
2019-B
2020-A
98.9
2019-C
70.1
2020-B
2020-A
98.4 98.1
76.0
2020-C
2020-B
Weighted Average Loan-to-Value (%)
72.8 71.8
2021-A
2020-C
2022-A
101.8 101.0
2021-A
69.1
2022-B
99.6
2022-A
65.8
2022-C
2022-B
62.9
2022-D
2022-C
63.6
2022-D
2023-A
100.3 100.4 100.6 101.4 100.9
67.2
2023-A
2023-B
2023-B
57.6
2018-A
8.6
2018-A
Original Term> 60 Mos. By Principal Balance (%)
-% Original Term >75 Mos.
58.0 56.4
2018-B
8.5
2018-B
2019-A
8.7
57.3
2019-A
2019-B
8.7
61.2
2019-B
2019-C
8.8
57.7
2019-C
2020-A
8.7
57.6
2020-A
2020-B
69.8
8.9
2020-B
2020-C
67.0
4.8 5.0 5.7 6.2
9.1
Weighted Average Payment-to-Income (%)
2020-C
2021-A
58.1
9.2
2021-A
2022-A
53.6
9.1
2022-A
2022-B
9.0
51.3 51.5
2022-B
6.6
2022-C
9.1
7.0
2022-C
2022-D
9.2
2022-D
54.6
2023-A
12.4 12.8
9.5
52.8
2023-A
2023-B
9.7
Ford
2023-B
33View entire presentation