Silicon Valley Bank Results Presentation Deck
Q2'19: A diversified loan portfolio
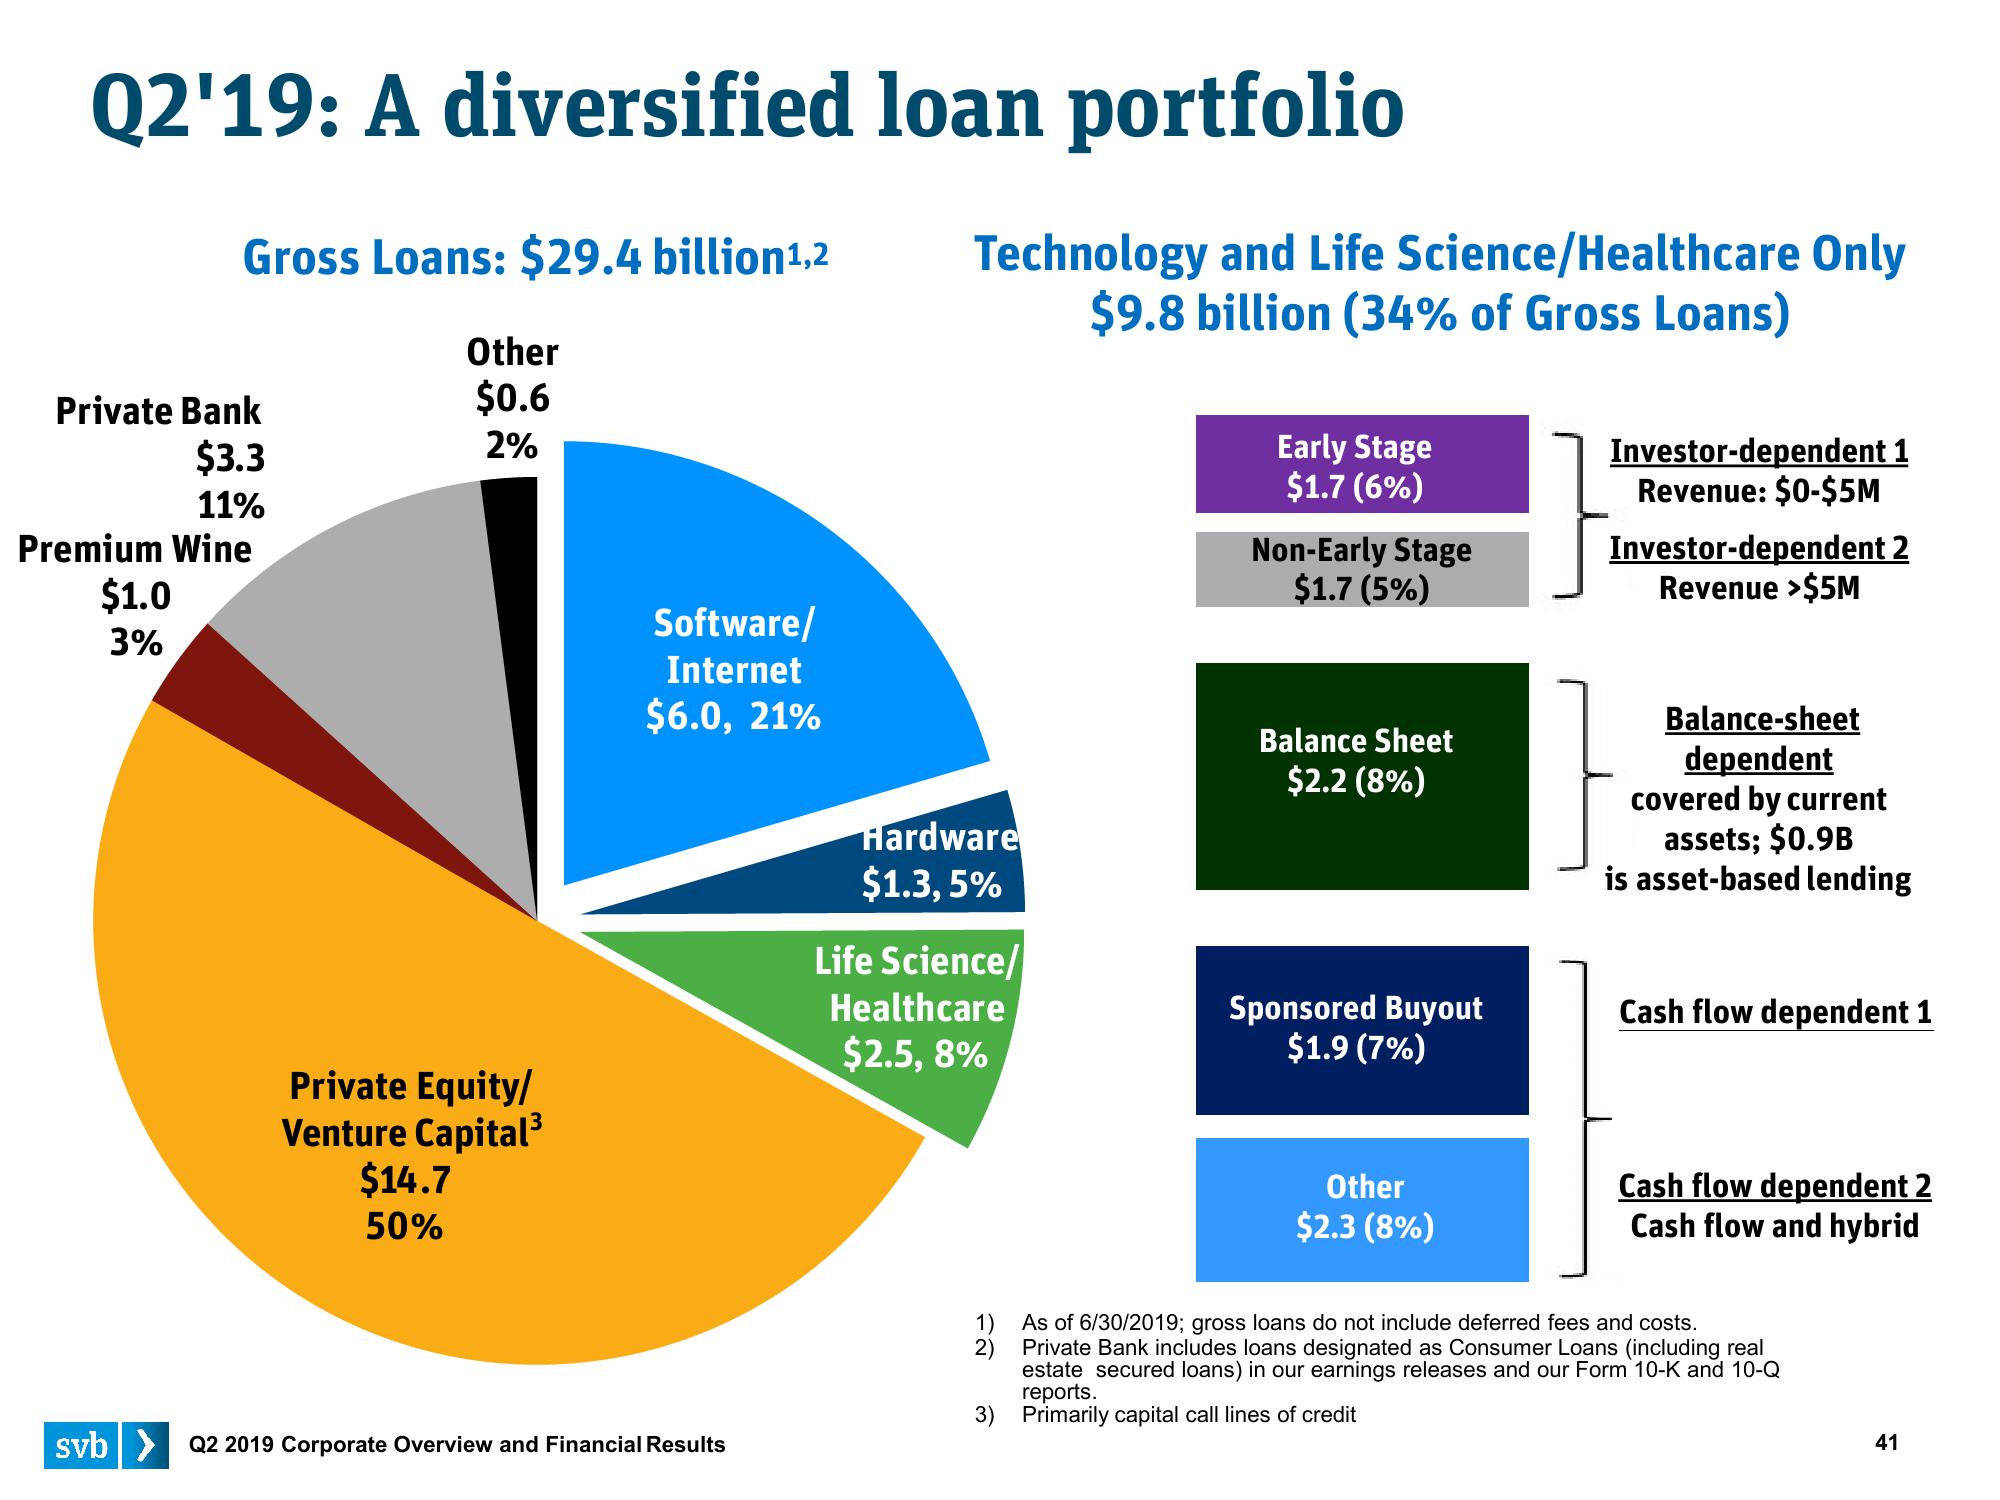
Gross Loans: $29.4 billion¹,2
Private Bank
$3.3
11%
Premium Wine
$1.0
3%
Other
$0.6
2%
Private Equity/
Venture Capital³
$14.7
50%
Software/
Internet
$6.0, 21%
svb> Q2 2019 Corporate Overview and Financial Results
Technology and Life Science/Healthcare Only
$9.8 billion (34% of Gross Loans)
Hardware
$1.3,5%
Life Science/
Healthcare
$2.5, 8%
Early Stage
$1.7 (6%)
1)
2)
Non-Early Stage
$1.7 (5%)
Balance Sheet
$2.2 (8%)
Sponsored Buyout
$1.9 (7%)
Other
$2.3 (8%)
Investor-dependent 1
Revenue: $0-$5M
Investor-dependent 2
Revenue >$5M
Balance-sheet
dependent
covered by current
assets; $0.9B
is asset-based lending
Cash flow dependent 1
Cash flow dependent 2
Cash flow and hybrid
As of 6/30/2019; gross loans do not include deferred fees and costs.
Private Bank includes loans designated as Consumer Loans (including real
estate secured loans) in our earnings releases and our Form 10-K and 10-Q
reports.
3) Primarily capital call lines of credit
41View entire presentation