GMS Results Presentation Deck
Q1 Fiscal 2024 Sales Highlights
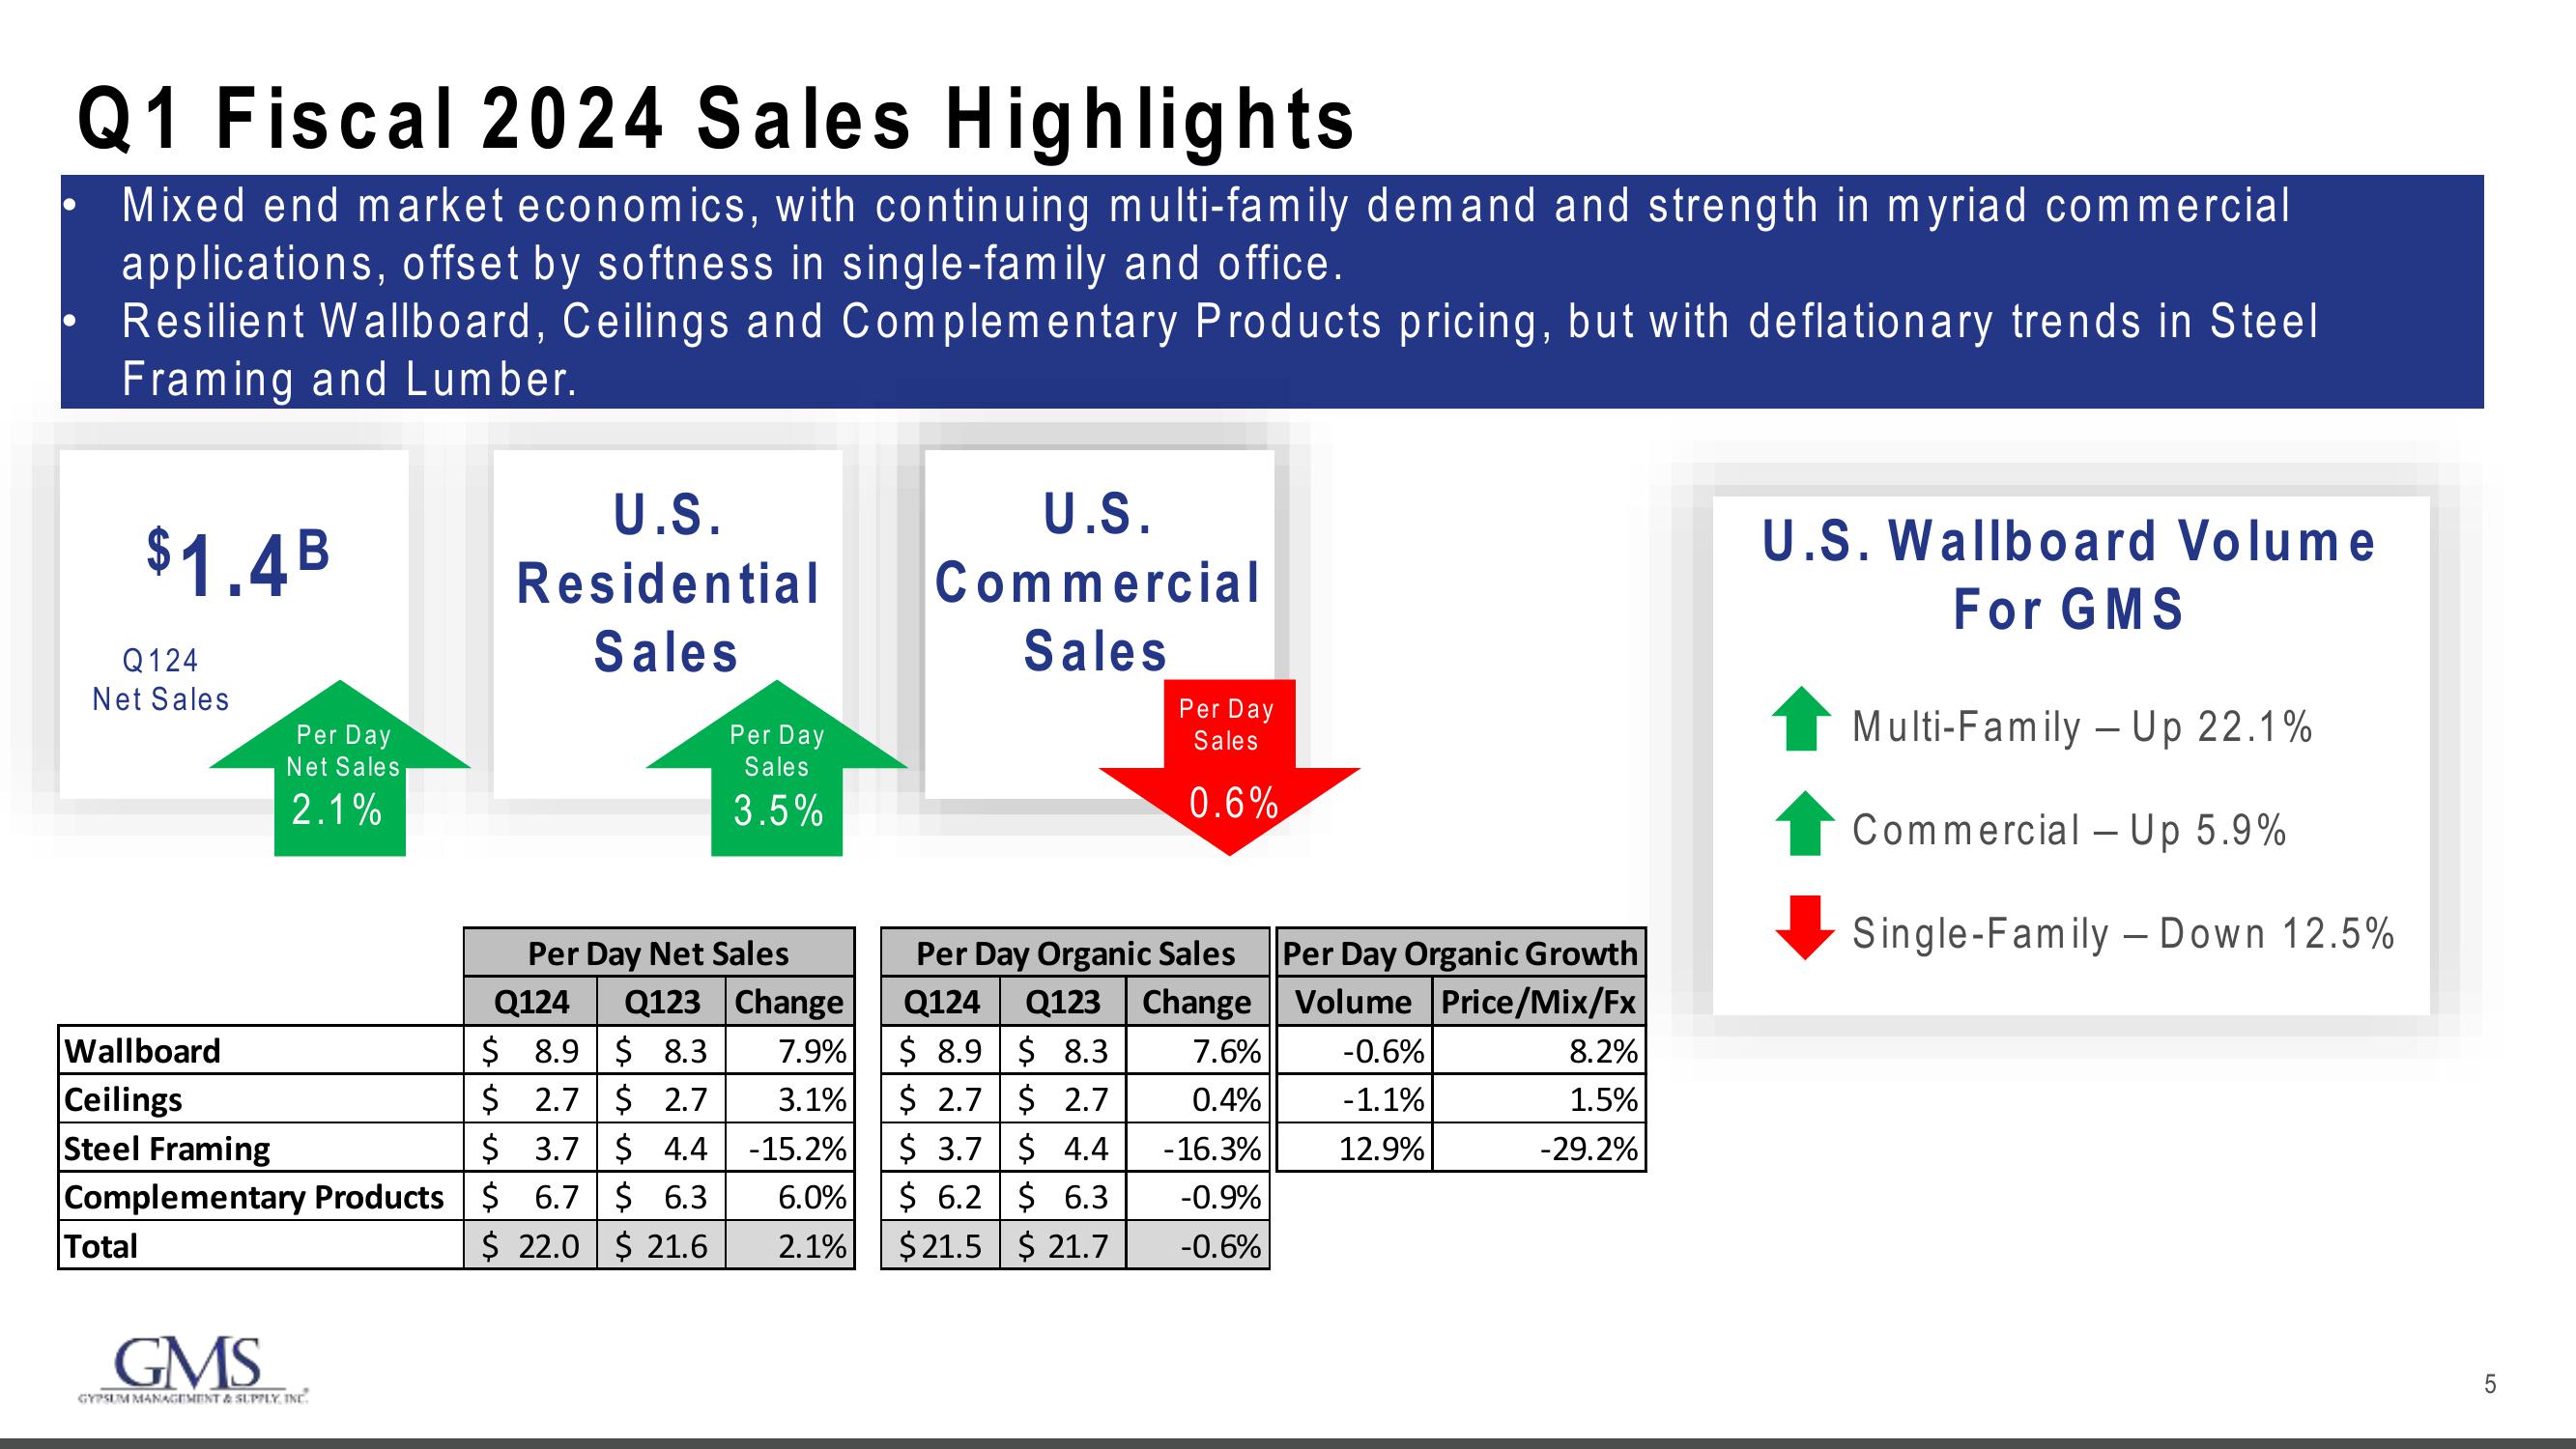
Mixed end market economics, with continuing multi-family demand and strength in myriad commercial
applications, offset by softness in single-family and office.
Resilient Wallboard, Ceilings and Complementary Products pricing, but with deflationary trends in Steel
Framing and Lumber.
$1.4B
Q124
Net Sales
Total
Per Day
Net Sales
2.1%
U.S.
Residential
Sales
Wallboard
Per Day Net Sales
Q124 Q123 Change
$ 8.9 $8.3 7.9%
$ 2.7 $ 2.7 3.1%
Steel Framing
$ 3.7 $ 4.4 -15.2%
Complementary Products $ 6.7 $ 6.3 6.0%
Ceilings
$ 22.0 $ 21.6
2.1%
GMS
GYPSUM MANAGEMENT & SUPPLY INC.
Per Day
Sales
3.5%
U.S.
Commercial
Sales
Per Day
Sales
0.6%
Per Day Organic Sales
Q124 Q123 Change
$8.9 $8.3 7.6%
$ 2.7 $ 2.7 0.4%
$ 3.7
$ 4.4
- 16.3%
$ 6.2
$ 6.3
-0.9%
$21.5 $ 21.7
-0.6%
Per Day Organic Growth
Volume Price/Mix/Fx
-0.6%
-1.1%
12.9%
8.2%
1.5%
-29.2%
U.S. Wallboard Volume
For GMS
Multi-Family - Up 22.1%
Commercial - Up 5.9%
Single-Family - Down 12.5%
5View entire presentation