BenevolentAI Investor Conference Presentation Deck
Our prolific drug discovery engine drives higher
productivity
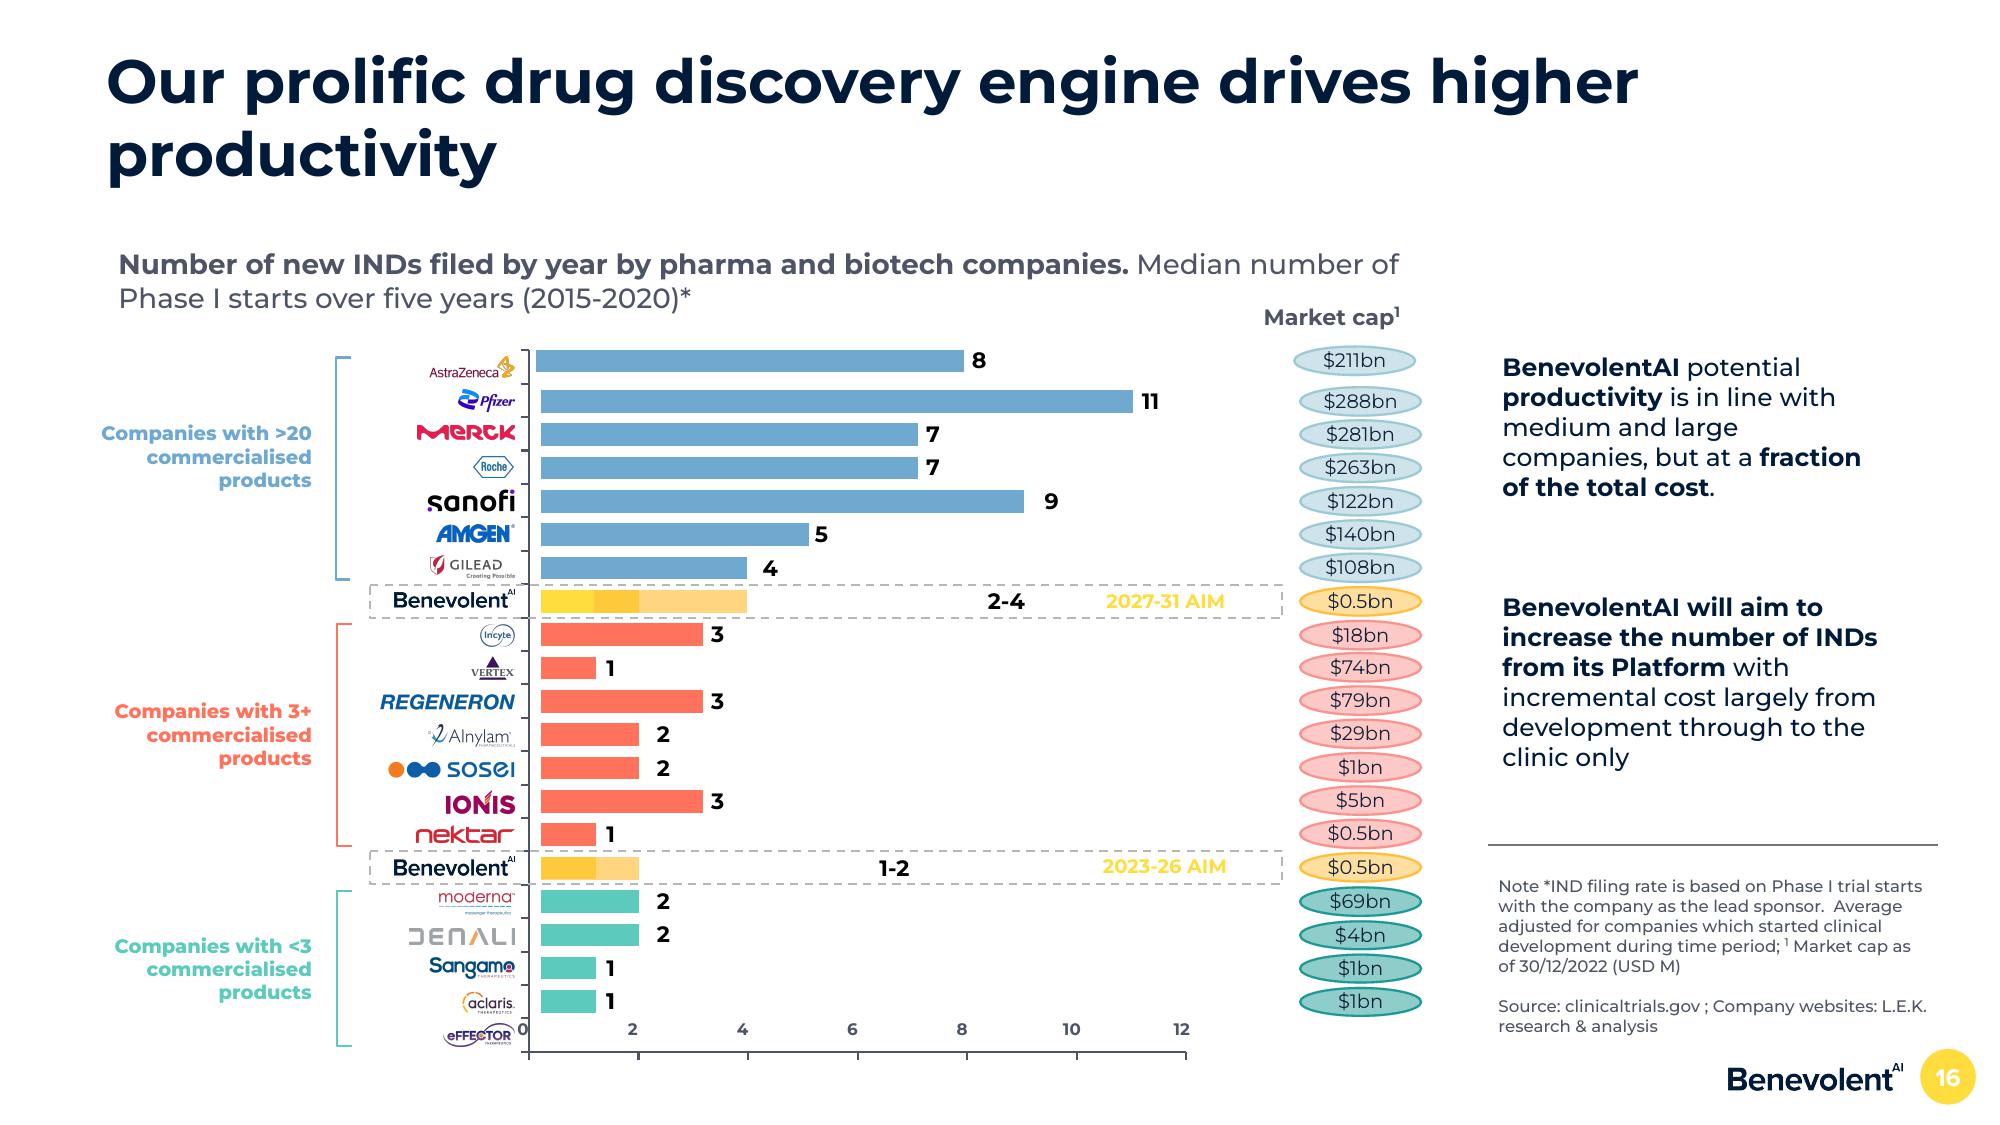
Number of new INDs filed by year by pharma and biotech companies. Median number of
Phase I starts over five years (2015-2020)*
Market cap¹
$211bn
$288bn
$281bn
$263bn
$122bn
$140bn
$108bn
$0.5bn
$18bn
$74bn
$79bn
$29bn
$1bn
$5bn
$0.5bn
Companies with >20
commercialised
products
Companies with 3+
commercialised
products
Companies with <3
commercialised
products
AstraZeneca
Pfizer
Merck
Roche
sanofi
AMGEN
GILEAD
Creating Possible
Benevolent
(Incyte)
VERTEX
REGENERON
Alnylam
sosel
IONIS
nektar
Benevolent
moderna
DENALI
Sangamo
aclaris.
EFFECTOR
1
2
2
2
N N
2
3
M
3
4
5
6
1-2
7
7
8
8
2-4
9
10
11
2027-31 AIM
2023-26 AIM
12
$0.5bn
$69bn
$4bn
$1bn
$1bn
BenevolentAl potential
productivity is in line with
medium and large
companies, but at a fraction
of the total cost.
BenevolentAl will aim to
increase the number of INDS
from its Platform with
incremental cost largely from
development through to the
clinic only
Note *IND filing rate is based on Phase I trial starts
with the company as the lead sponsor. Average
adjusted for companies which started clinical
development during time period; ¹ Market cap as
of 30/12/2022 (USD M)
Source: clinicaltrials.gov; Company websites: L.E.K.
research & analysis
Benevolent 16View entire presentation