Spotify Results Presentation Deck
Operating Expenses
Y/Y decline led by lower marketing and personnel costs
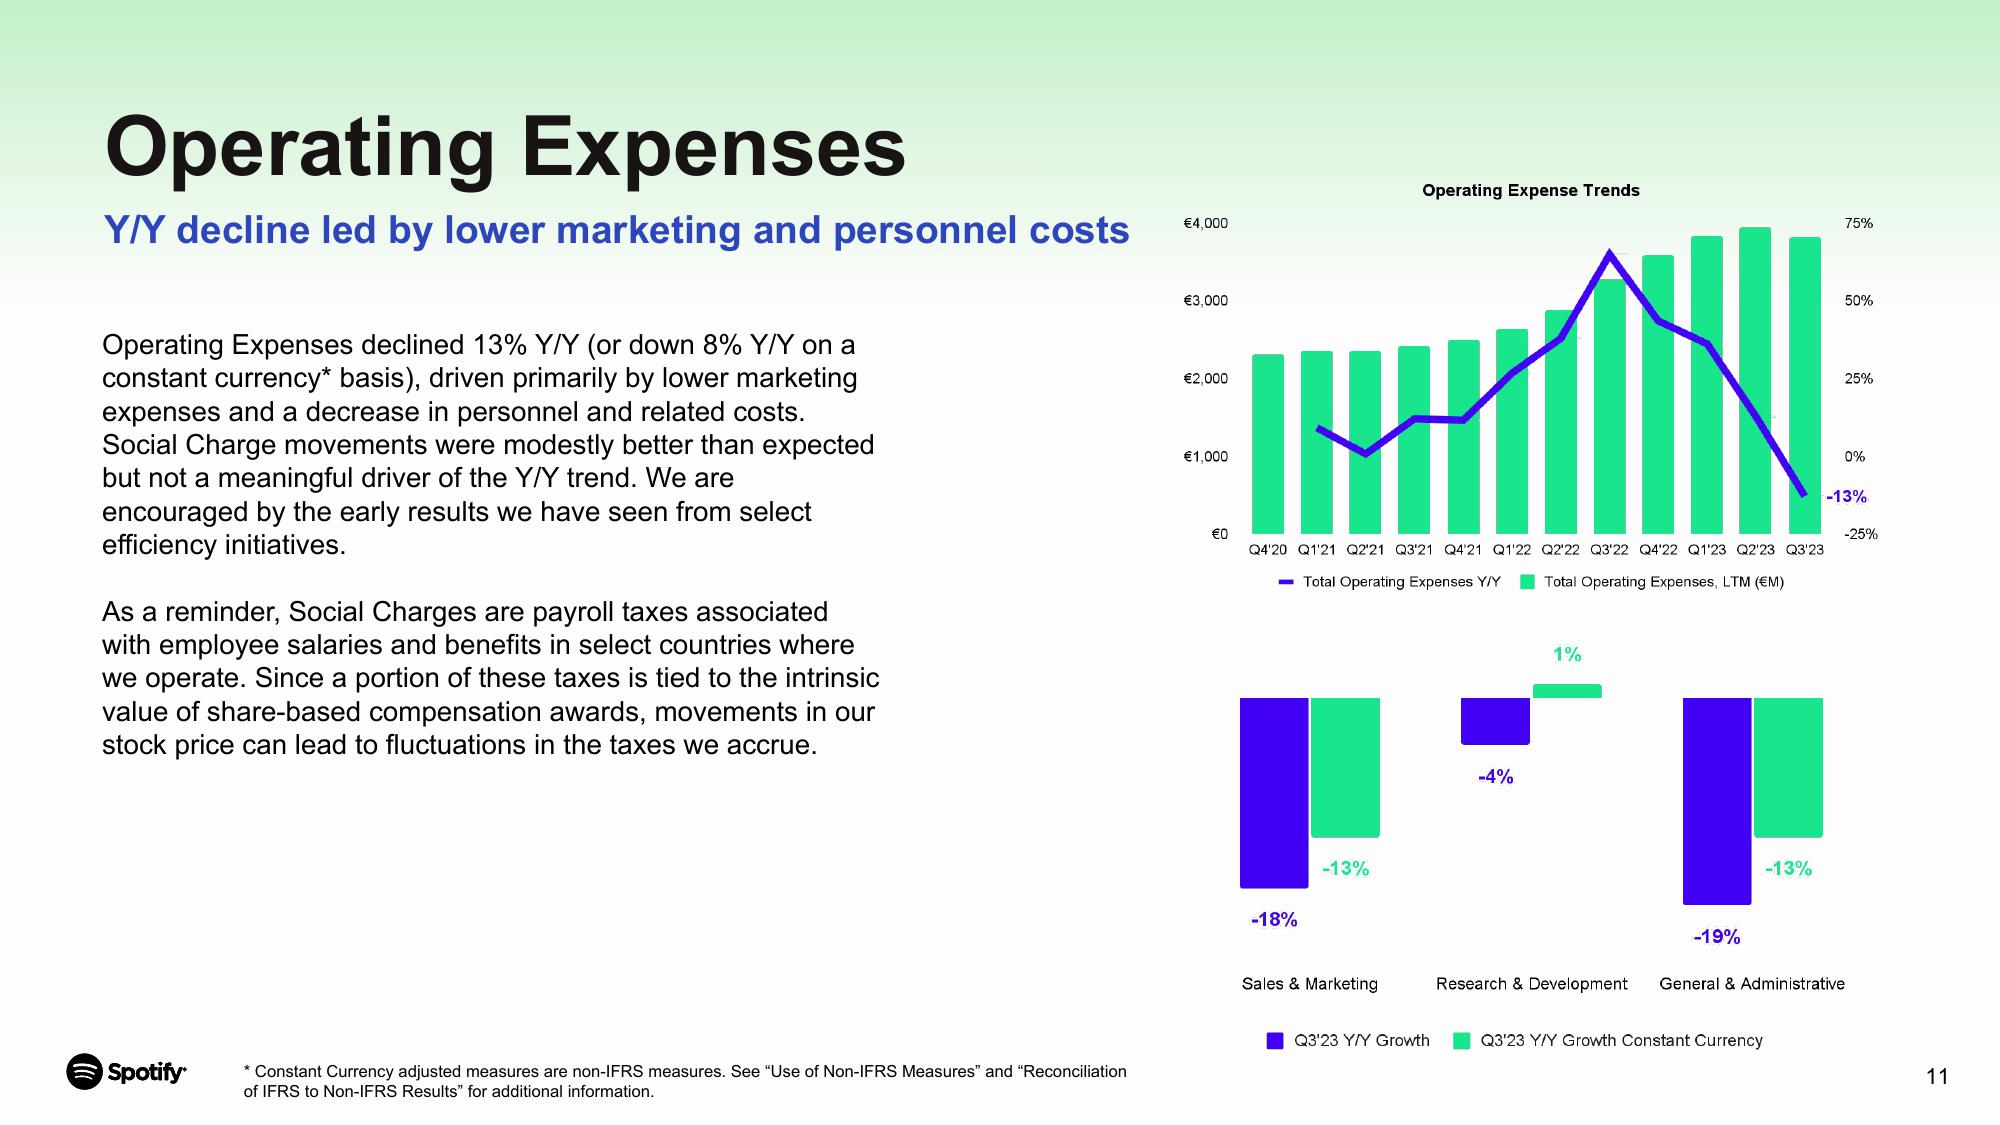
Operating Expenses declined 13% Y/Y (or down 8% Y/Y on a
constant currency* basis), driven primarily by lower marketing
expenses and a decrease in personnel and related costs.
Social Charge movements were modestly better than expected
but not a meaningful driver of the Y/Y trend. We are
encouraged by the early results we have seen from select
efficiency initiatives.
As a reminder, Social Charges are payroll taxes associated
with employee salaries and benefits in select countries where
we operate. Since a portion of these taxes is tied to the intrinsic
value of share-based compensation awards, movements in our
stock price can lead to fluctuations in the taxes we accrue.
Spotify
* Constant Currency adjusted measures are non-IFRS measures. See "Use of Non-IFRS Measures" and "Reconciliation
of IFRS to Non-IFRS Results" for additional information.
€4,000
€3,000
€2,000
€1,000
€0
MI
Q4'20 Q1'21 Q2'21 Q3'21 Q4'21 Q1'22
- Total Operating Expenses Y/Y
-18%
-13%
Operating Expense Trends
Sales & Marketing
Q3'23 Y/Y Growth
-4%
TH
Q2'22 Q3'22 Q4'22 Q1'23 Q2'23 Q3'23
Total Operating Expenses, LTM (€M)
1%
-19%
-13%
Q3'23 Y/Y Growth Constant Currency
75%
50%
25%
0%
-13%
-25%
Research & Development General & Administrative
11View entire presentation