Innovid SPAC Presentation Deck
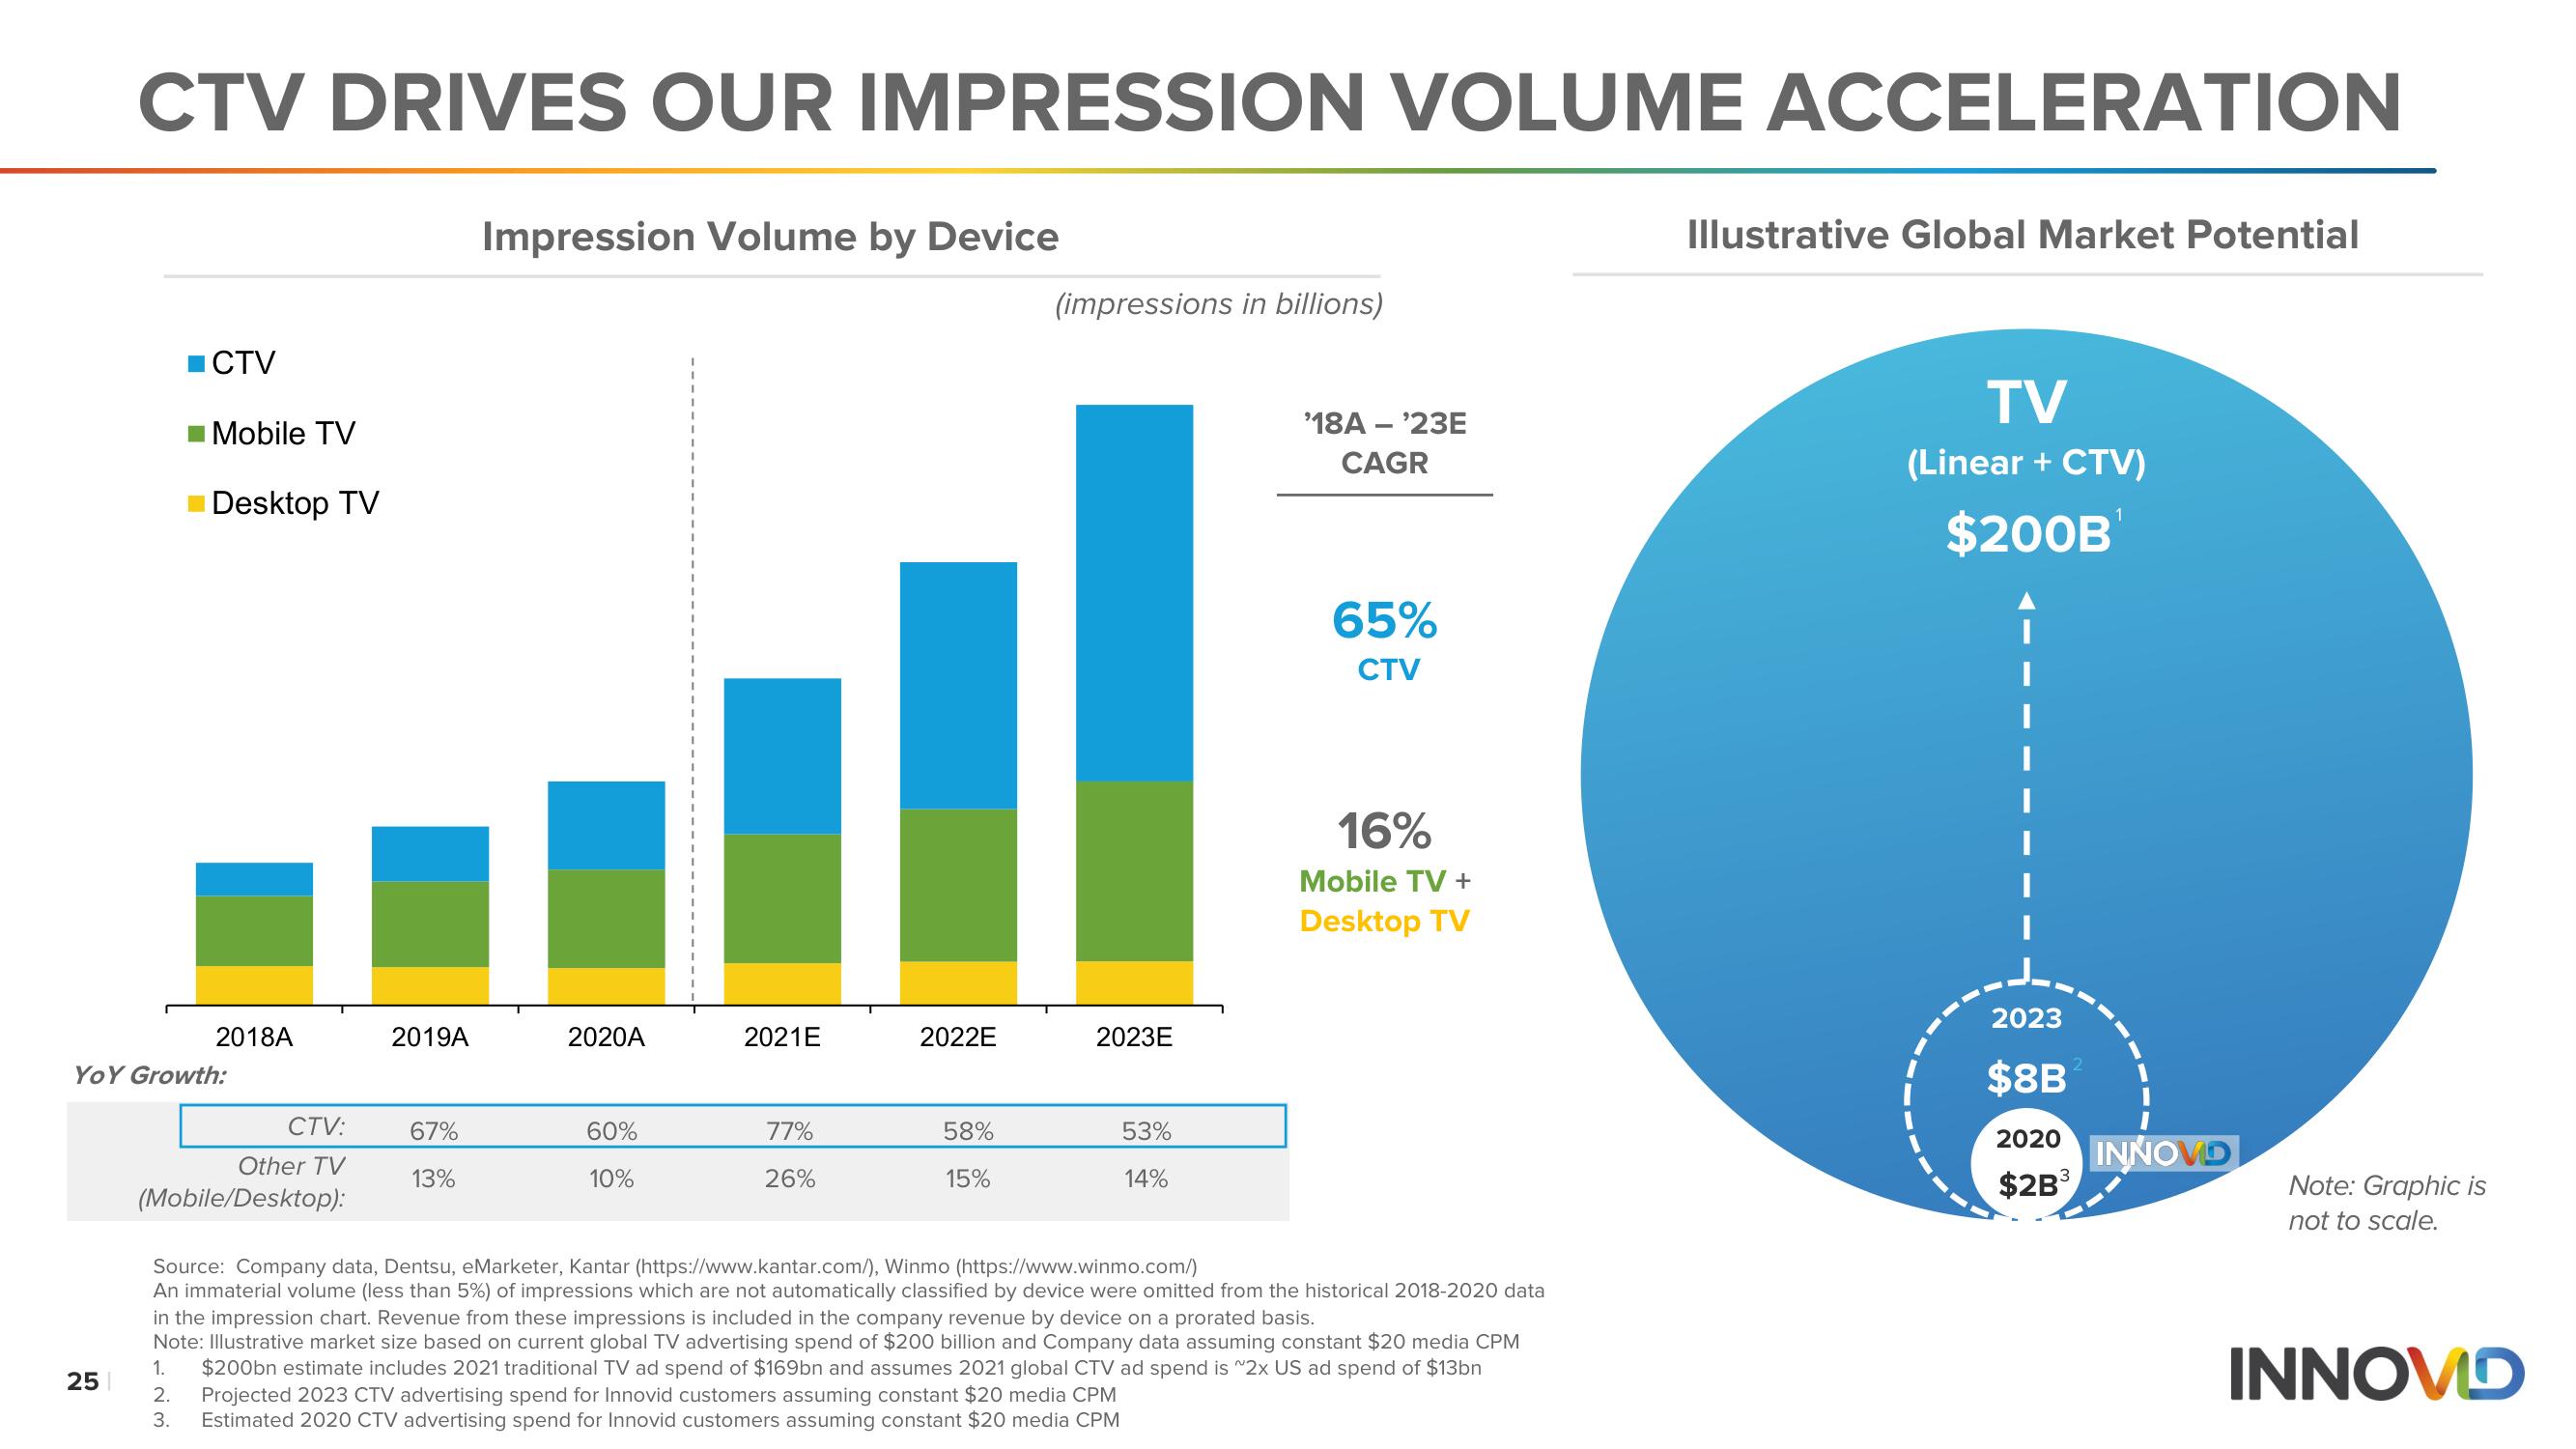
CTV DRIVES OUR IMPRESSION VOLUME ACCELERATION
25
CTV
■Mobile TV
Desktop TV
2018A
YOY Growth:
CTV:
Other TV
(Mobile/Desktop):
2019A
67%
13%
Impression Volume by Device
2020A
60%
10%
2021E
77%
26%
■
2022E
58%
15%
(impressions in billions)
2023E
53%
14%
'18A - ¹23E
CAGR
65%
CTV
16%
Mobile TV +
Desktop TV
Source: Company data, Dentsu, eMarketer, Kantar (https://www.kantar.com/), Winmo (https://www.winmo.com/)
An immaterial volume (less than 5%) of impressions which are not automatically classified by device were omitted from the historical 2018-2020 data
in the impression chart. Revenue from these impressions is included in the company revenue by device on a prorated basis.
Note: Illustrative market size based on current global TV advertising spend of $200 billion and Company data assuming constant $20 media CPM
1. $200bn estimate includes 2021 traditional TV ad spend of $169bn and assumes 2021 global CTV ad spend is "2x US ad spend of $13bn
2. Projected 2023 CTV advertising spend for Innovid customers assuming constant $20 media CPM
3.
Estimated 2020 CTV advertising spend for Innovid customers assuming constant $20 media CPM
Illustrative Global Market Potential
TV
(Linear + CTV)
$200B
2023
$8B
2
2020
$2B³
INNOVD
Note: Graphic is
not to scale.
INNOVDView entire presentation