jetBlue Results Presentation Deck
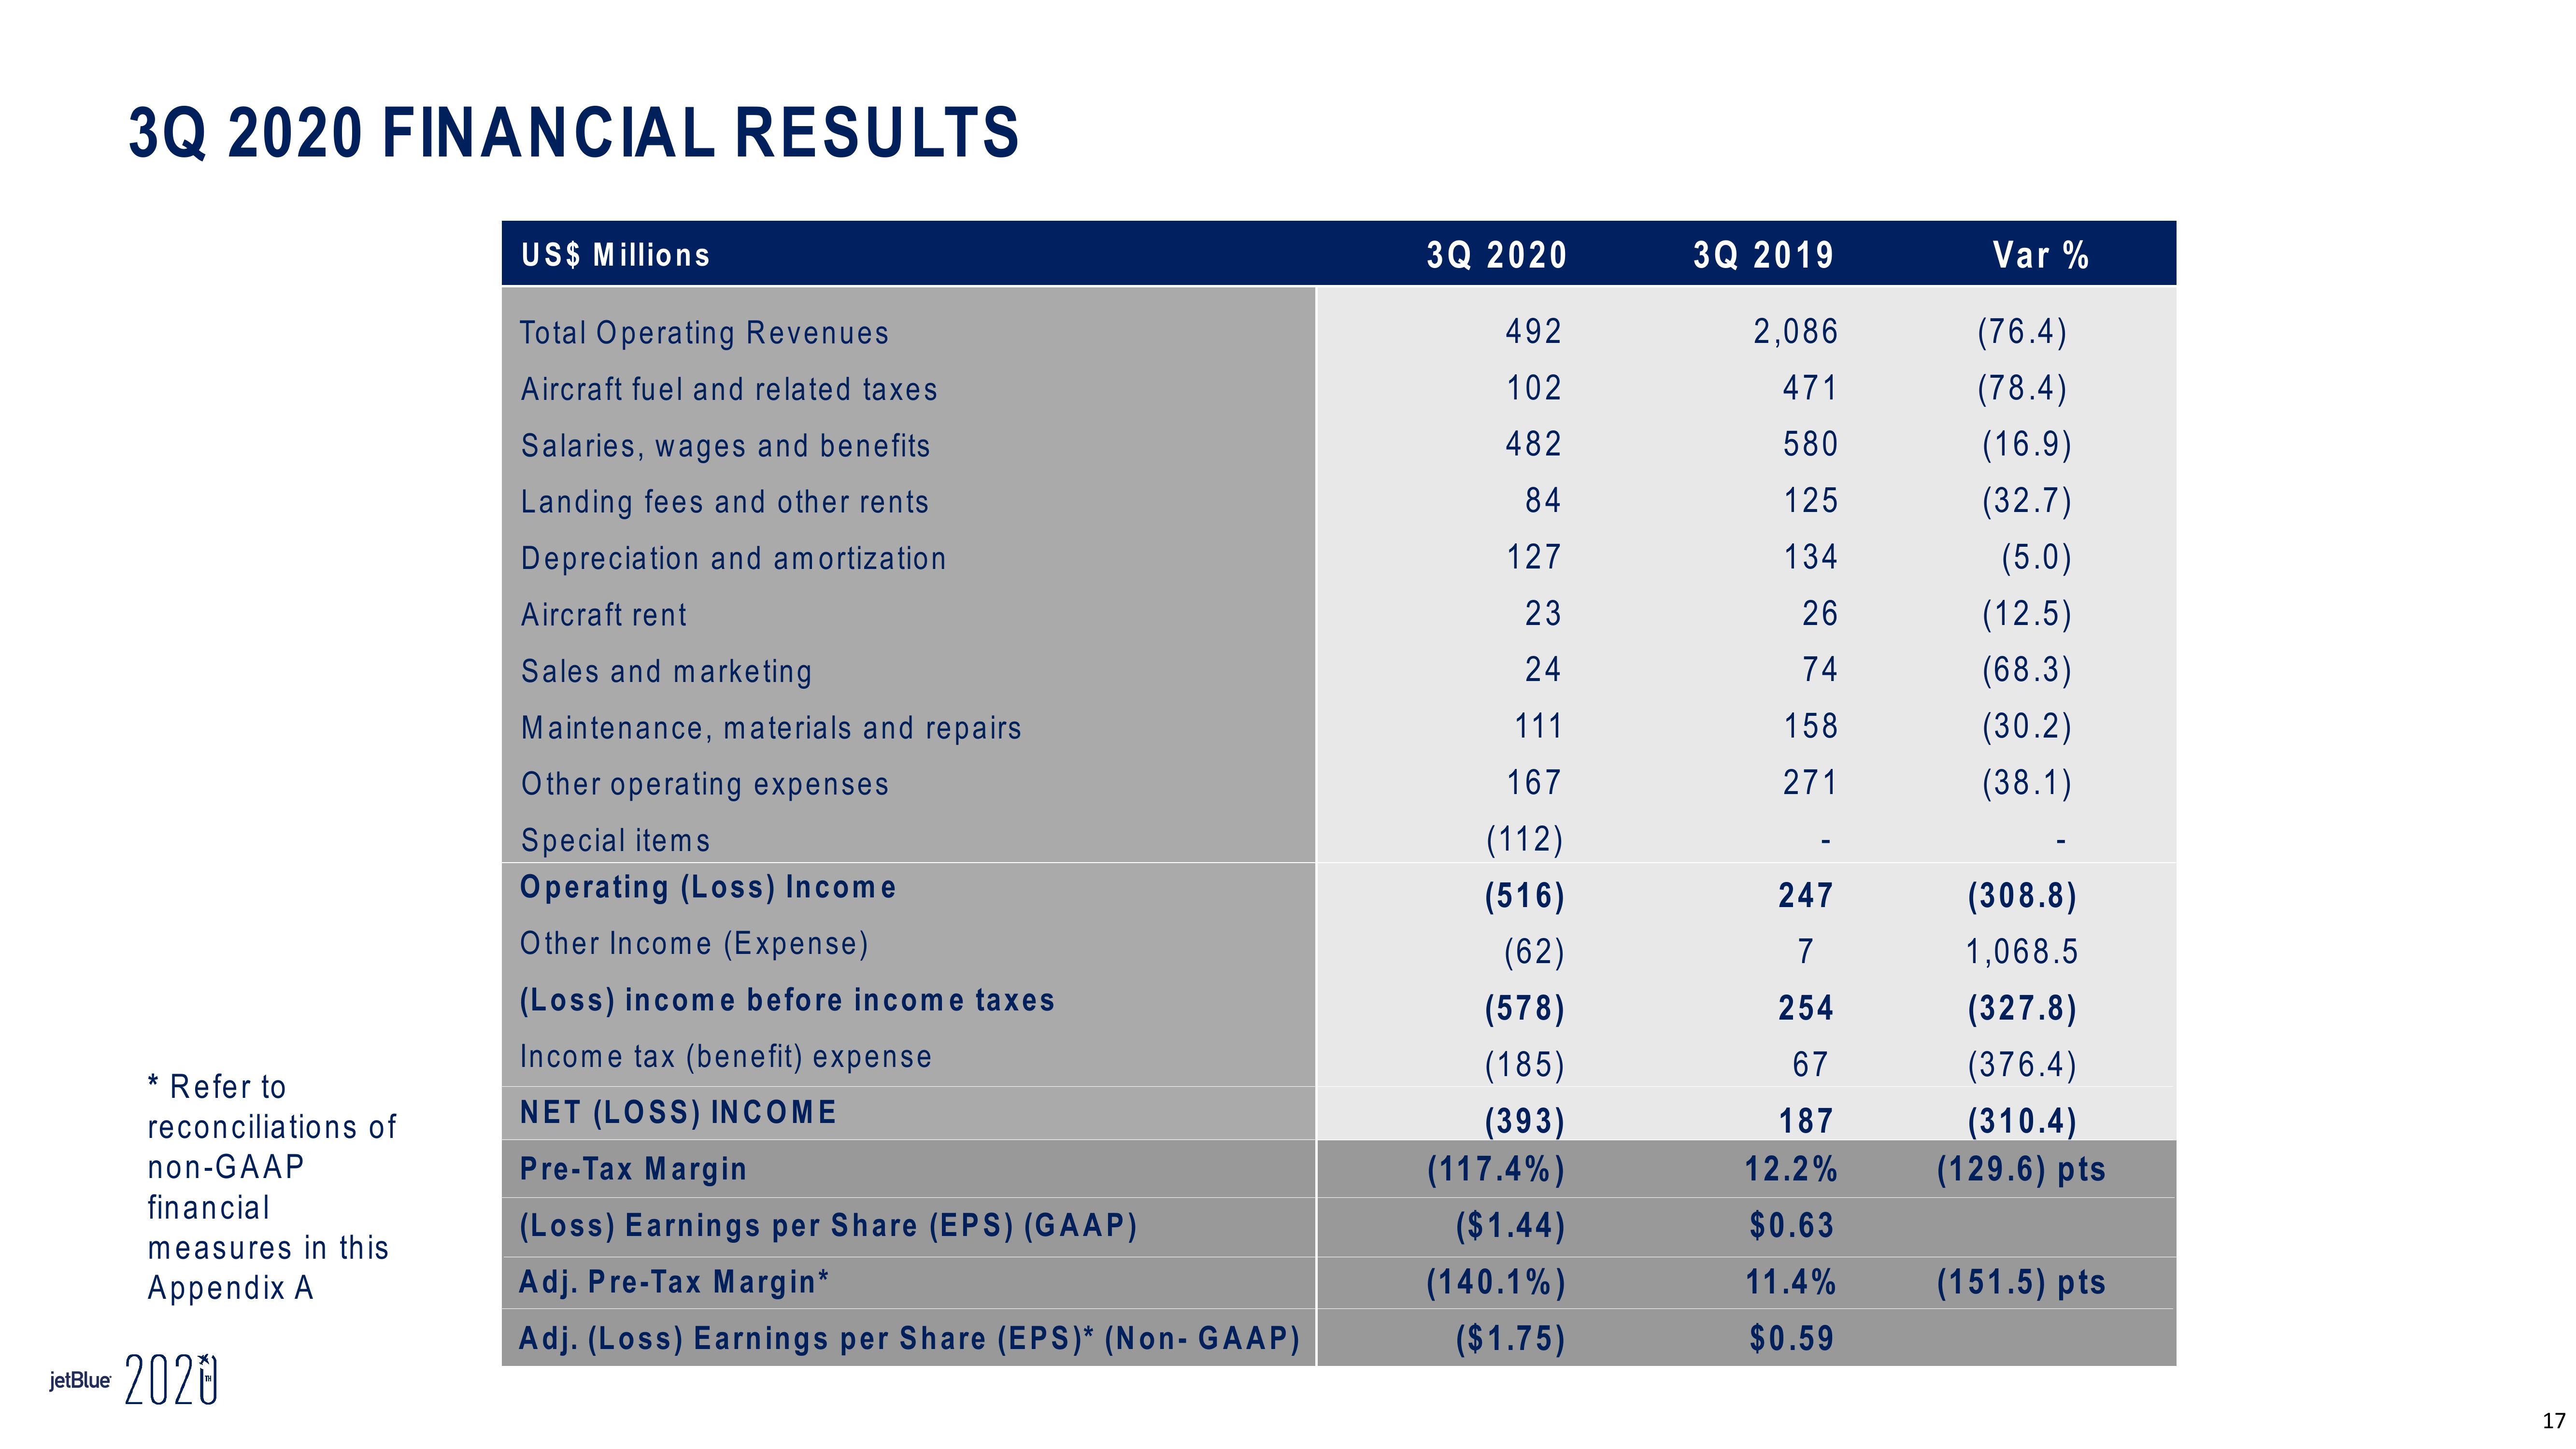
3Q 2020 FINANCIAL RESULTS
* Refer to
reconciliations of
non-GAAP
financial
measures in this
Appendix A
jetBlue 2020
US$ Millions
Total Operating Revenues
Aircraft fuel and related taxes
Salaries, wages and benefits
Landing fees and other rents
Depreciation and amortization
Aircraft rent
Sales and marketing
Maintenance, materials and repairs
Other operating expenses
Special items
Operating (Loss) Income
Other Income (Expense)
(Loss) income before income taxes
Income tax (benefit) expense
NET (LOSS) INCOME
Pre-Tax Margin
(Loss) Earnings per Share (EPS) (GAAP)
Adj. Pre-Tax Margin*
Adj. (Loss) Earnings per Share (EPS)* (Non- GAAP)
3Q 2020
492
102
482
84
127
23
24
111
167
(112)
(516)
(62)
(578)
(185)
(393)
(117.4%)
($1.44)
(140.1%)
($1.75)
3Q 2019
2,086
471
580
125
134
26
74
158
271
247
7
254
67
187
12.2%
$0.63
11.4%
$0.59
Var %
(76.4)
(78.4)
(16.9)
(32.7)
(5.0)
(12.5)
(68.3)
(30.2)
(38.1)
(308.8)
1,068.5
(327.8)
(376.4)
(310.4)
(129.6) pts
(151.5) pts
17View entire presentation