Bed Bath & Beyond Results Presentation Deck
APPENDIX
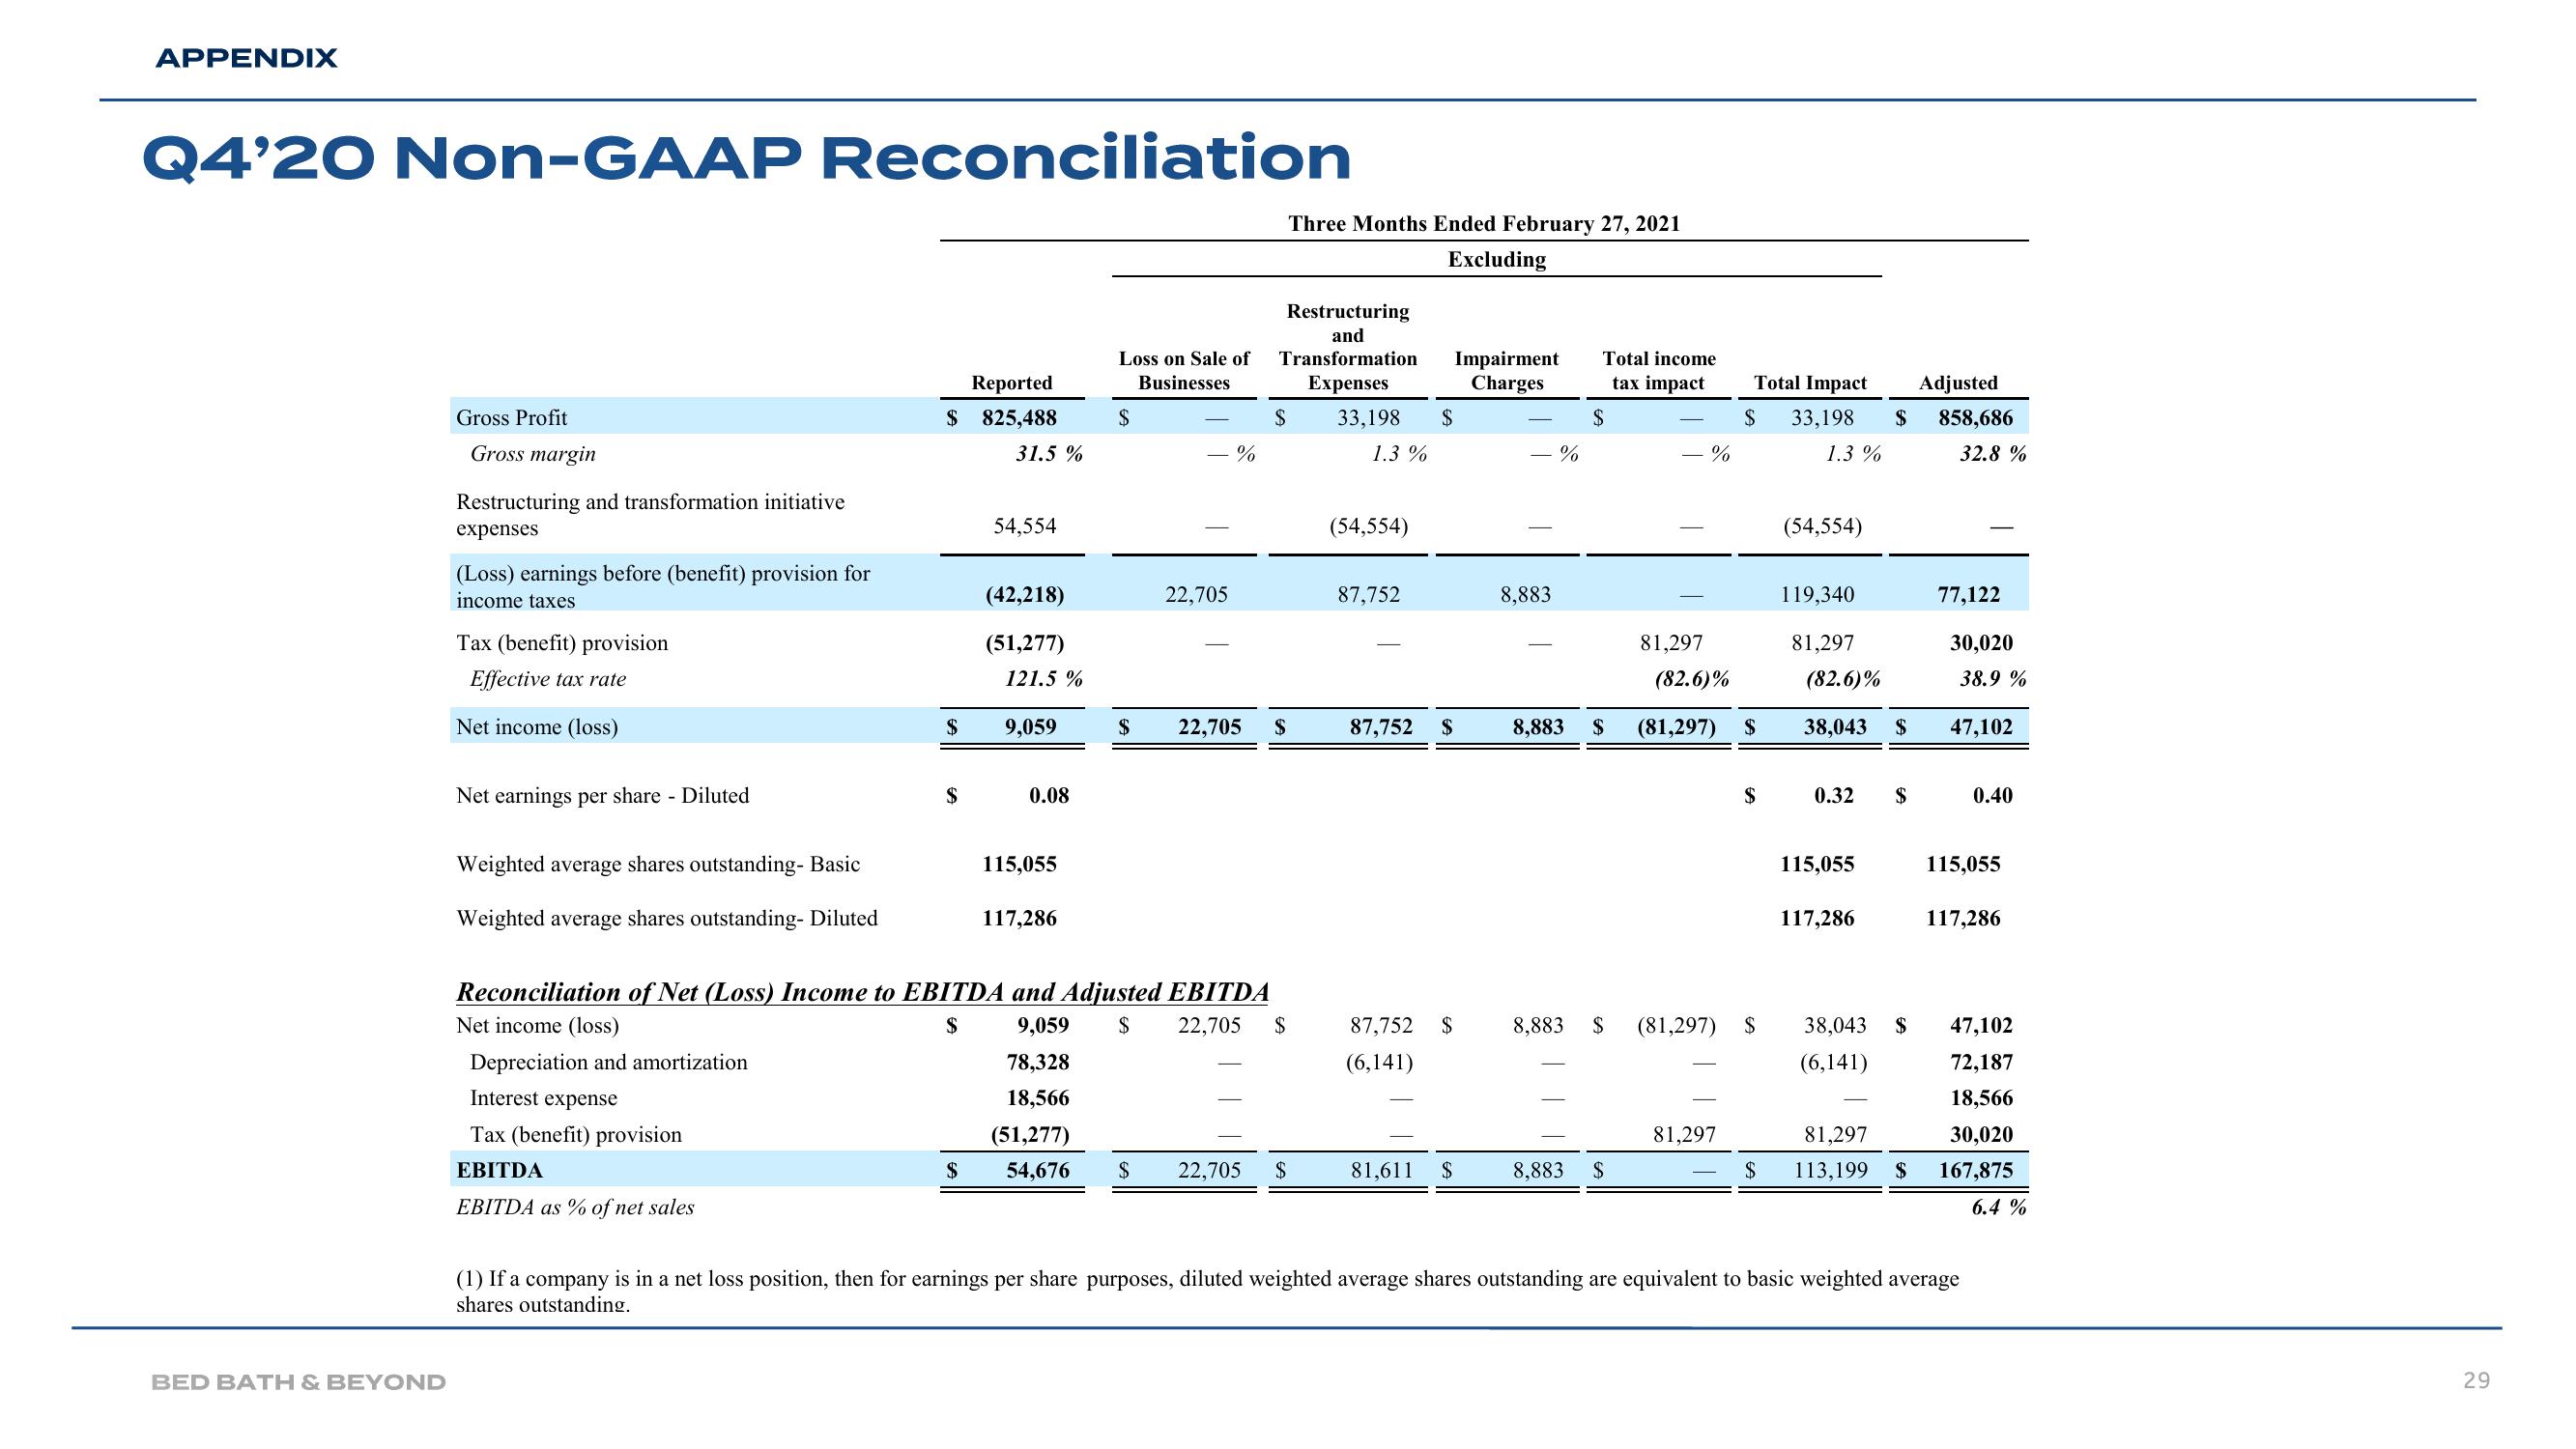
Q4'20 Non-GAAP Reconciliation
BED BATH & BEYOND
Gross Profit
Gross margin
Restructuring and transformation initiative
expenses
(Loss) earnings before (benefit) provision for
income taxes
Tax (benefit) provision
Effective tax rate
Net income (loss)
Net earnings per share - Diluted
Weighted average shares outstanding- Basic
Weighted average shares outstanding- Diluted
Reported
$ 825,488
Interest expense
Tax (benefit) provision
EBITDA
EBITDA as % of net sales
$
$
31.5%
$
54,554
(42,218)
(51,277)
121.5 %
9,059
0.08
115,055
117,286
Loss on Sale of
Businesses
$
- %
22,705
Restructuring
and
Transformation
Expenses
33,198 $
1.3 %
$
Reconciliation of Net (Loss) Income to EBITDA and Adjusted EBITDA
Net income (loss)
$
9,059 $ 22,705 $
78,328
Depreciation and amortization
18,566
(51,277)
54,676 $ 22,705 $
$ 22,705 $
Three Months Ended February 27, 2021
Excluding
(54,554)
87,752
87,752 $
87,752 $
(6,141)
Impairment
Charges
81,611 $
- %
8,883
Total income
tax impact
$
8,883 $
8,883 $
8,883 $
- %
81,297
(82.6)%
(81,297) $
(81,297)
Total Impact
$
81,297
$
$
Adjusted
33,198 $ 858,686
1.3 %
32.8%
(54,554)
119,340
81,297
0.32 $
(82.6)%
38,043 $ 47,102
115,055
117,286
38,043 $
(6,141)
77,122
81,297
$ 113,199 $
30,020
38.9%
0.40
115,055
117,286
47,102
72,187
18,566
30,020
167,875
(1) If a company is in a net loss position, then for earnings per share purposes, diluted weighted average shares outstanding are equivalent to basic weighted average
shares outstanding.
6.4%
29View entire presentation