Bed Bath & Beyond Results Presentation Deck
APPENDIX
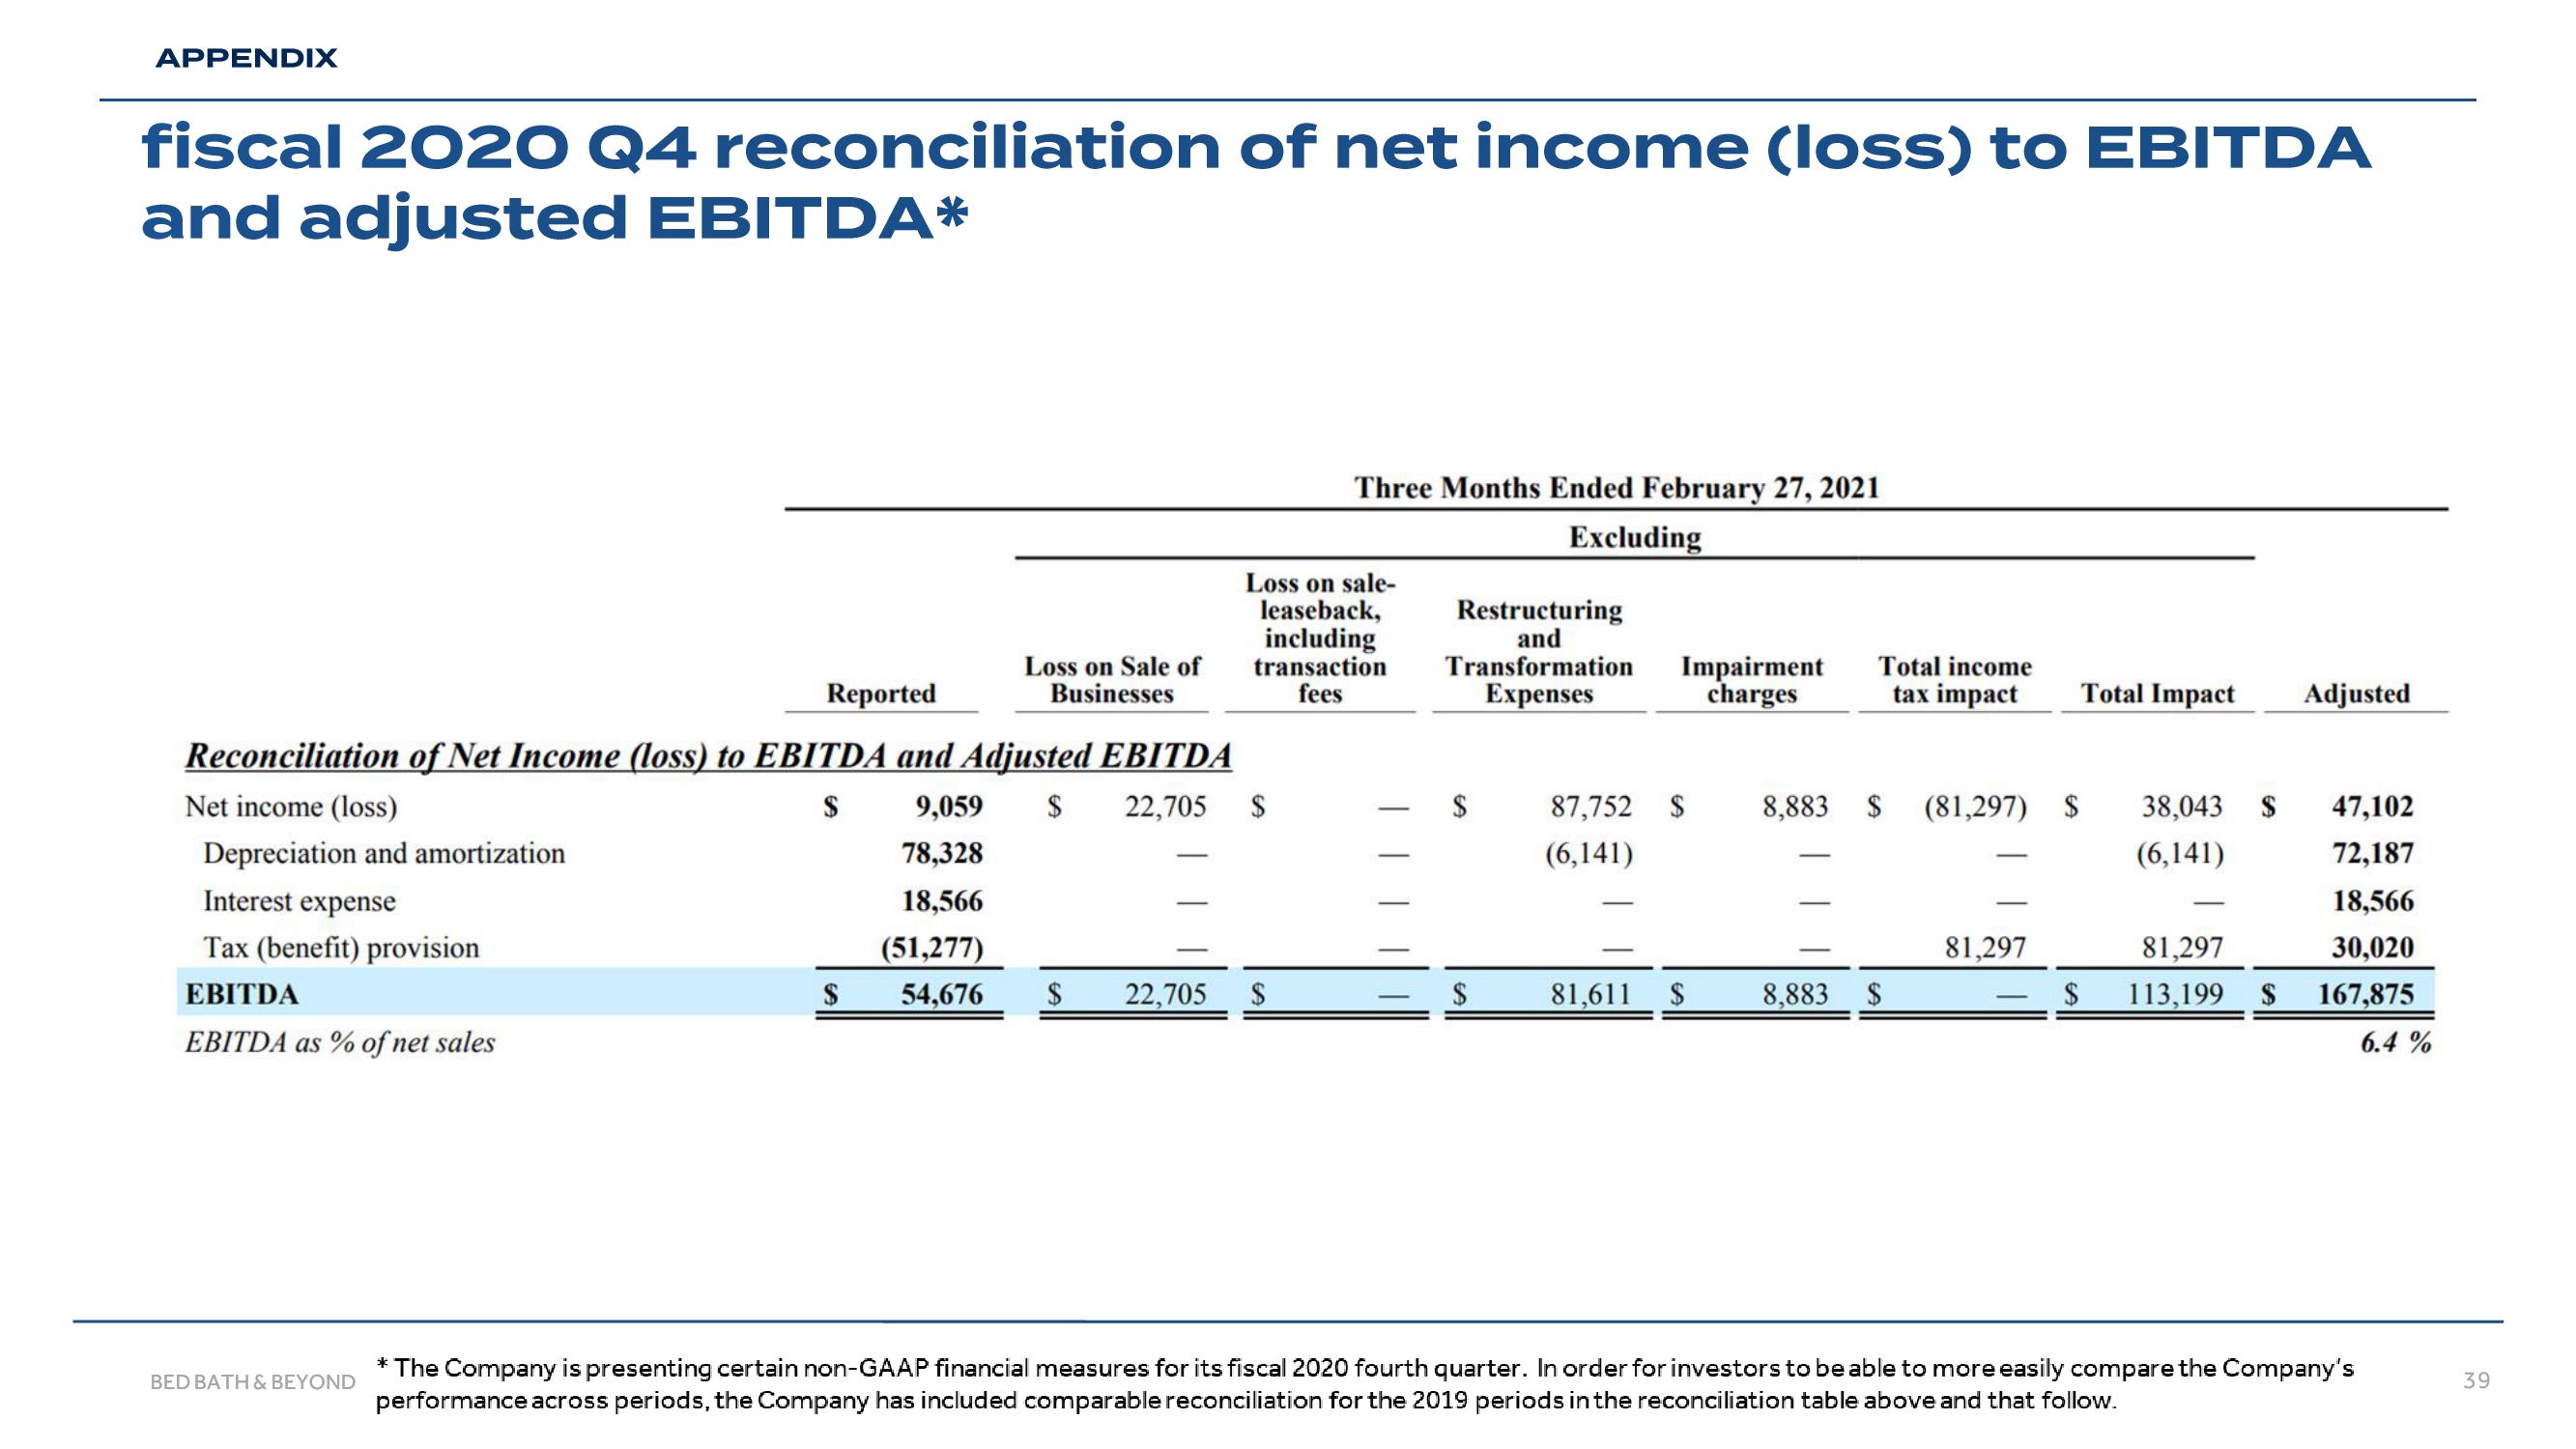
fiscal 2020 Q4 reconciliation of net income (loss) to EBITDA
and adjusted EBITDA*
Interest expense
Tax (benefit) provision
EBITDA
EBITDA as % of net sales
Reported
Reconciliation of Net Income (loss) to EBITDA and Adjusted EBITDA
Net income (loss)
9,059 $ 22,705 $
Depreciation and amortization
78,328
18,566
(51,277)
54,676 $ 22,705 $
BED BATH & BEYOND
Loss on Sale of
Businesses
$
Three Months Ended February 27, 2021
Excluding
Loss on sale-
leaseback,
including
transaction
fees
Restructuring
and
Transformation Impairment
Expenses
charges
$
$
87,752 $
(6,141)
81,611 $
Total income
tax impact
8,883 $
8,883 $
(81,297) $
81,297
Total Impact
$
38,043 $
(6,141)
81,297
113,199 $
Adjusted
47,102
72,187
18,566
30,020
167,875
* The Company is presenting certain non-GAAP financial measures for its fiscal 2020 fourth quarter. In order for investors to be able to more easily compare the Company's
performance across periods, the Company has included comparable reconciliation for the 2019 periods in the reconciliation table above and that follow.
6.4%
39View entire presentation