Rocket Lab SPAC Presentation Deck
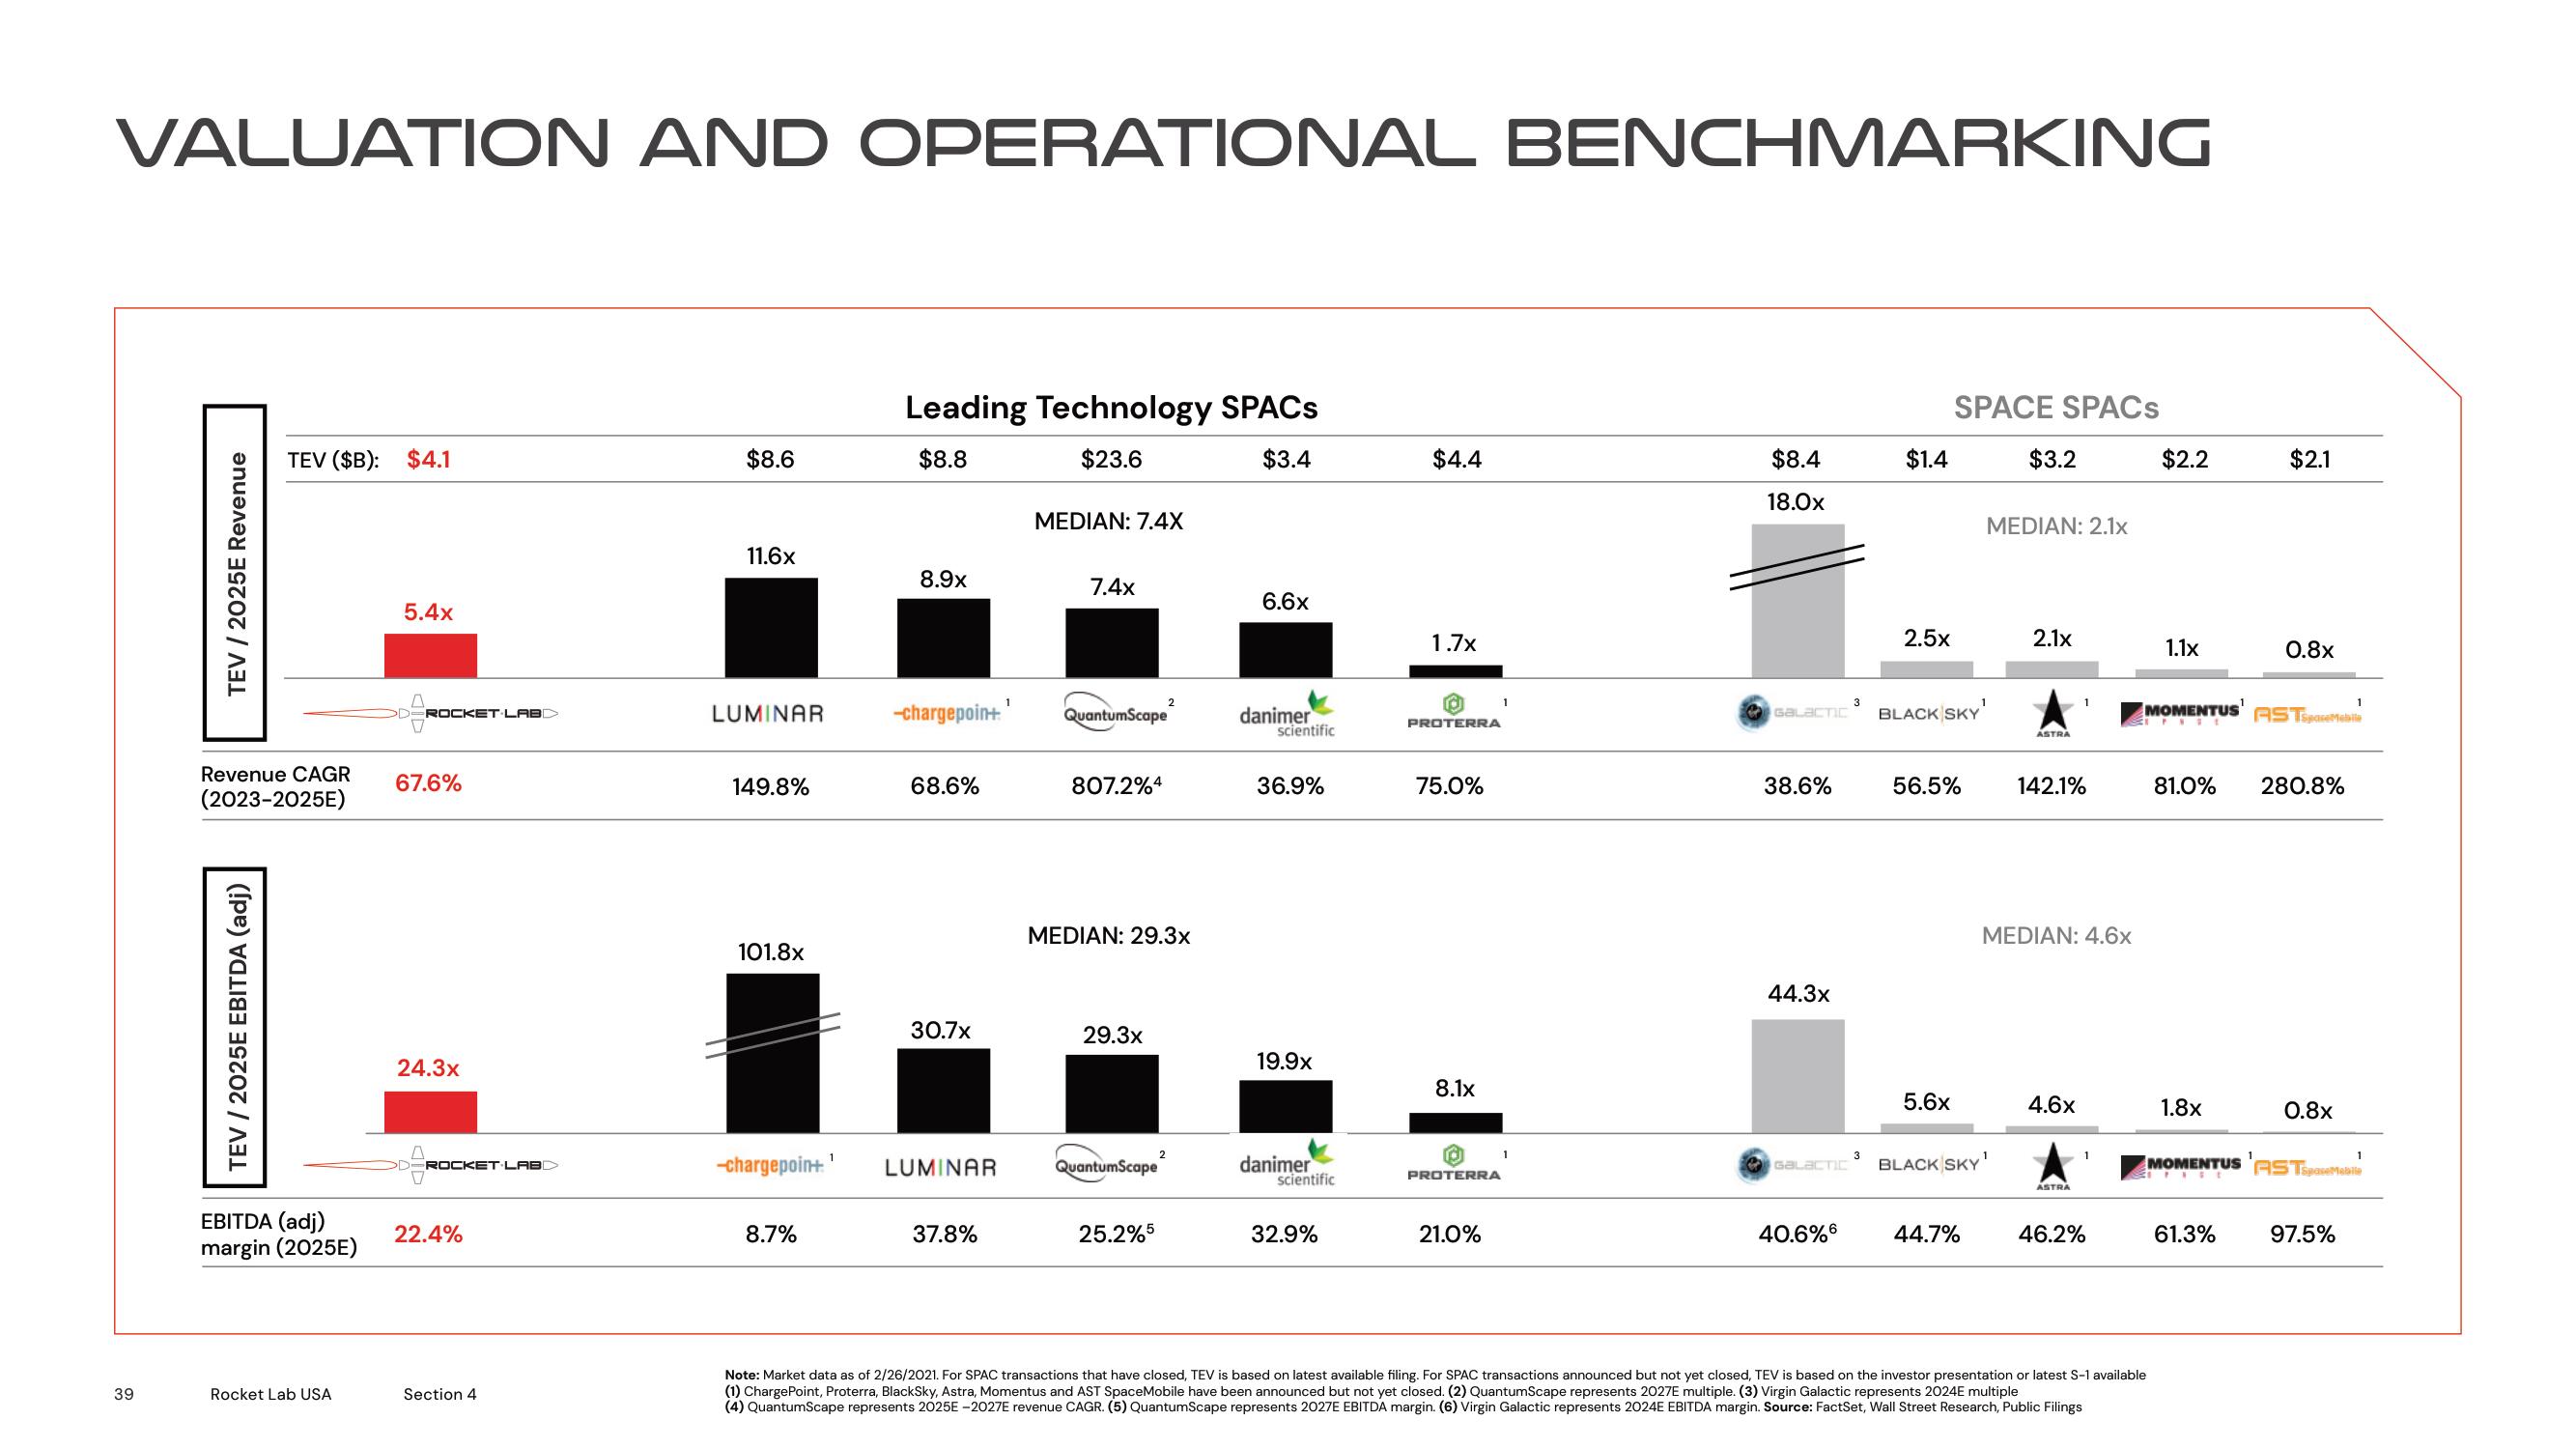
VALUATION AND OPERATIONAL BENCHMARKING
39
TEV / 2025E Revenue
TEV ($B): $4.1
Revenue CAGR
(2023-2025E)
TEV / 2025E EBITDA (adj)
EBITDA (adj)
margin (2025E)
Rocket Lab USA
5.4x
ROCKET LABD
67.6%
24.3x
ROCKET LABD
22.4%
Section 4
$8.6
11.6x
LUMINAR
149.8%
101.8x
-chargepoin+¹
8.7%
Leading Technology SPACs
$8.8
$23.6
$3.4
8.9x
-chargepoin+¹
68.6%
30.7x
LUMINAR
37.8%
MEDIAN: 7.4X
7.4x
QuantumScape
807.2%4
MEDIAN: 29.3x
29.3x
2
QuantumScape
25.2%5
2
6.6x
danimer
scientific
36.9%
19.9x
danimer
scientific
32.9%
$4.4
1.7x
PROTERRA
75.0%
8.1x
PROTERRA
21.0%
1
1
$8.4
18.0x
GALACTIC
38.6%
44.3x
GALACTIC
40.6%
3
3
$1.4
2.5x
SPACE SPACs
BLACK SKY
56.5%
5.6x
44.7%
$3.2
MEDIAN: 2.1x
BLACK SKY¹
2.1x
ASTRA
142.1%
MEDIAN: 4.6x
4.6x
ASTRA
1
46.2%
$2.2
Note: Market data as of 2/26/2021. For SPAC transactions that have closed, TEV is based on latest available filing. For SPAC transactions announced but not yet closed, TEV is based on the investor presentation or latest S-1 available
(1) ChargePoint, Proterra, BlackSky, Astra, Momentus and AST SpaceMobile have been announced but not yet closed. (2) QuantumScape represents 2027E multiple. (3) Virgin Galactic represents 2024E multiple
(4) QuantumScape represents 2025E-2027E revenue CAGR. (5) QuantumScape represents 2027E EBITDA margin. (6) Virgin Galactic represents 2024E EBITDA margin. Source: FactSet, Wall Street Research, Public Filings
1.1x
MOMENTUS AST
SPESE
1.8x
$2.1
81.0% 280.8%
MOMENTUS
0.8x
61.3%
0.8x
1
ASTSpaseMobile
97.5%View entire presentation