Dutch Bros Results Presentation Deck
($ in thousands)
Total revenues
Selling, general, and administrative
As a percentage of total revenue
Adjustments
SG&A LEVERAGE
1
3
2
2
Adjusted selling, general, and administrative
As a percentage of total revenue
Compared to the prior year
Equity-based compensation
Expenses associated with equity offering
Donations associated with equity offering
COVID-19: prepaid costs not utilized
Milestone events
Executive transitions costs
Total adjustments
$
$
Q1
98,785
35,986 $
36.4 %
(14,650)
(76)
2021
Q2
Q3
Q4
$ 129,208 $ 129,803 $ 140,080
33,488 $ 153,700 $
25.9 %
118.4 %
(8,332)
(2,253)
(124,779)
(3,332)
(1,392)
41,355 $
29.5 %
(9,955)
(862)
(2,400)
Q1
$ 152,156
$
$ (14,726) $ (10,585) $ (129,503) $ (13,217)
21,260 $ 22,903 $ 24,197 $
21.5 %
17.7%
18.6 %
12
(9,900)
Q2
$ 186,381
45,214 $ 42,342
29.7 %
22.7%
(1,200)
(2,434)
2022
(10,446)
Q4
Q3
$ 198,648 $ 201,827
$
45,378 $
22.8 %
(10,649)
50,594 $
25.1 %
(10,662)
(691)
$ (13,534) $ (10,446) $ (10,649) $ (12,458)
28,138 $ 31,680 $ 31,896 $ 34,729 $ 38,136
20.1 %
17.1%
17.5 %
20.8 %
18.9 %
(0.7)%
(0.6)%
(1.1)%
(1.2)%
(1,105)
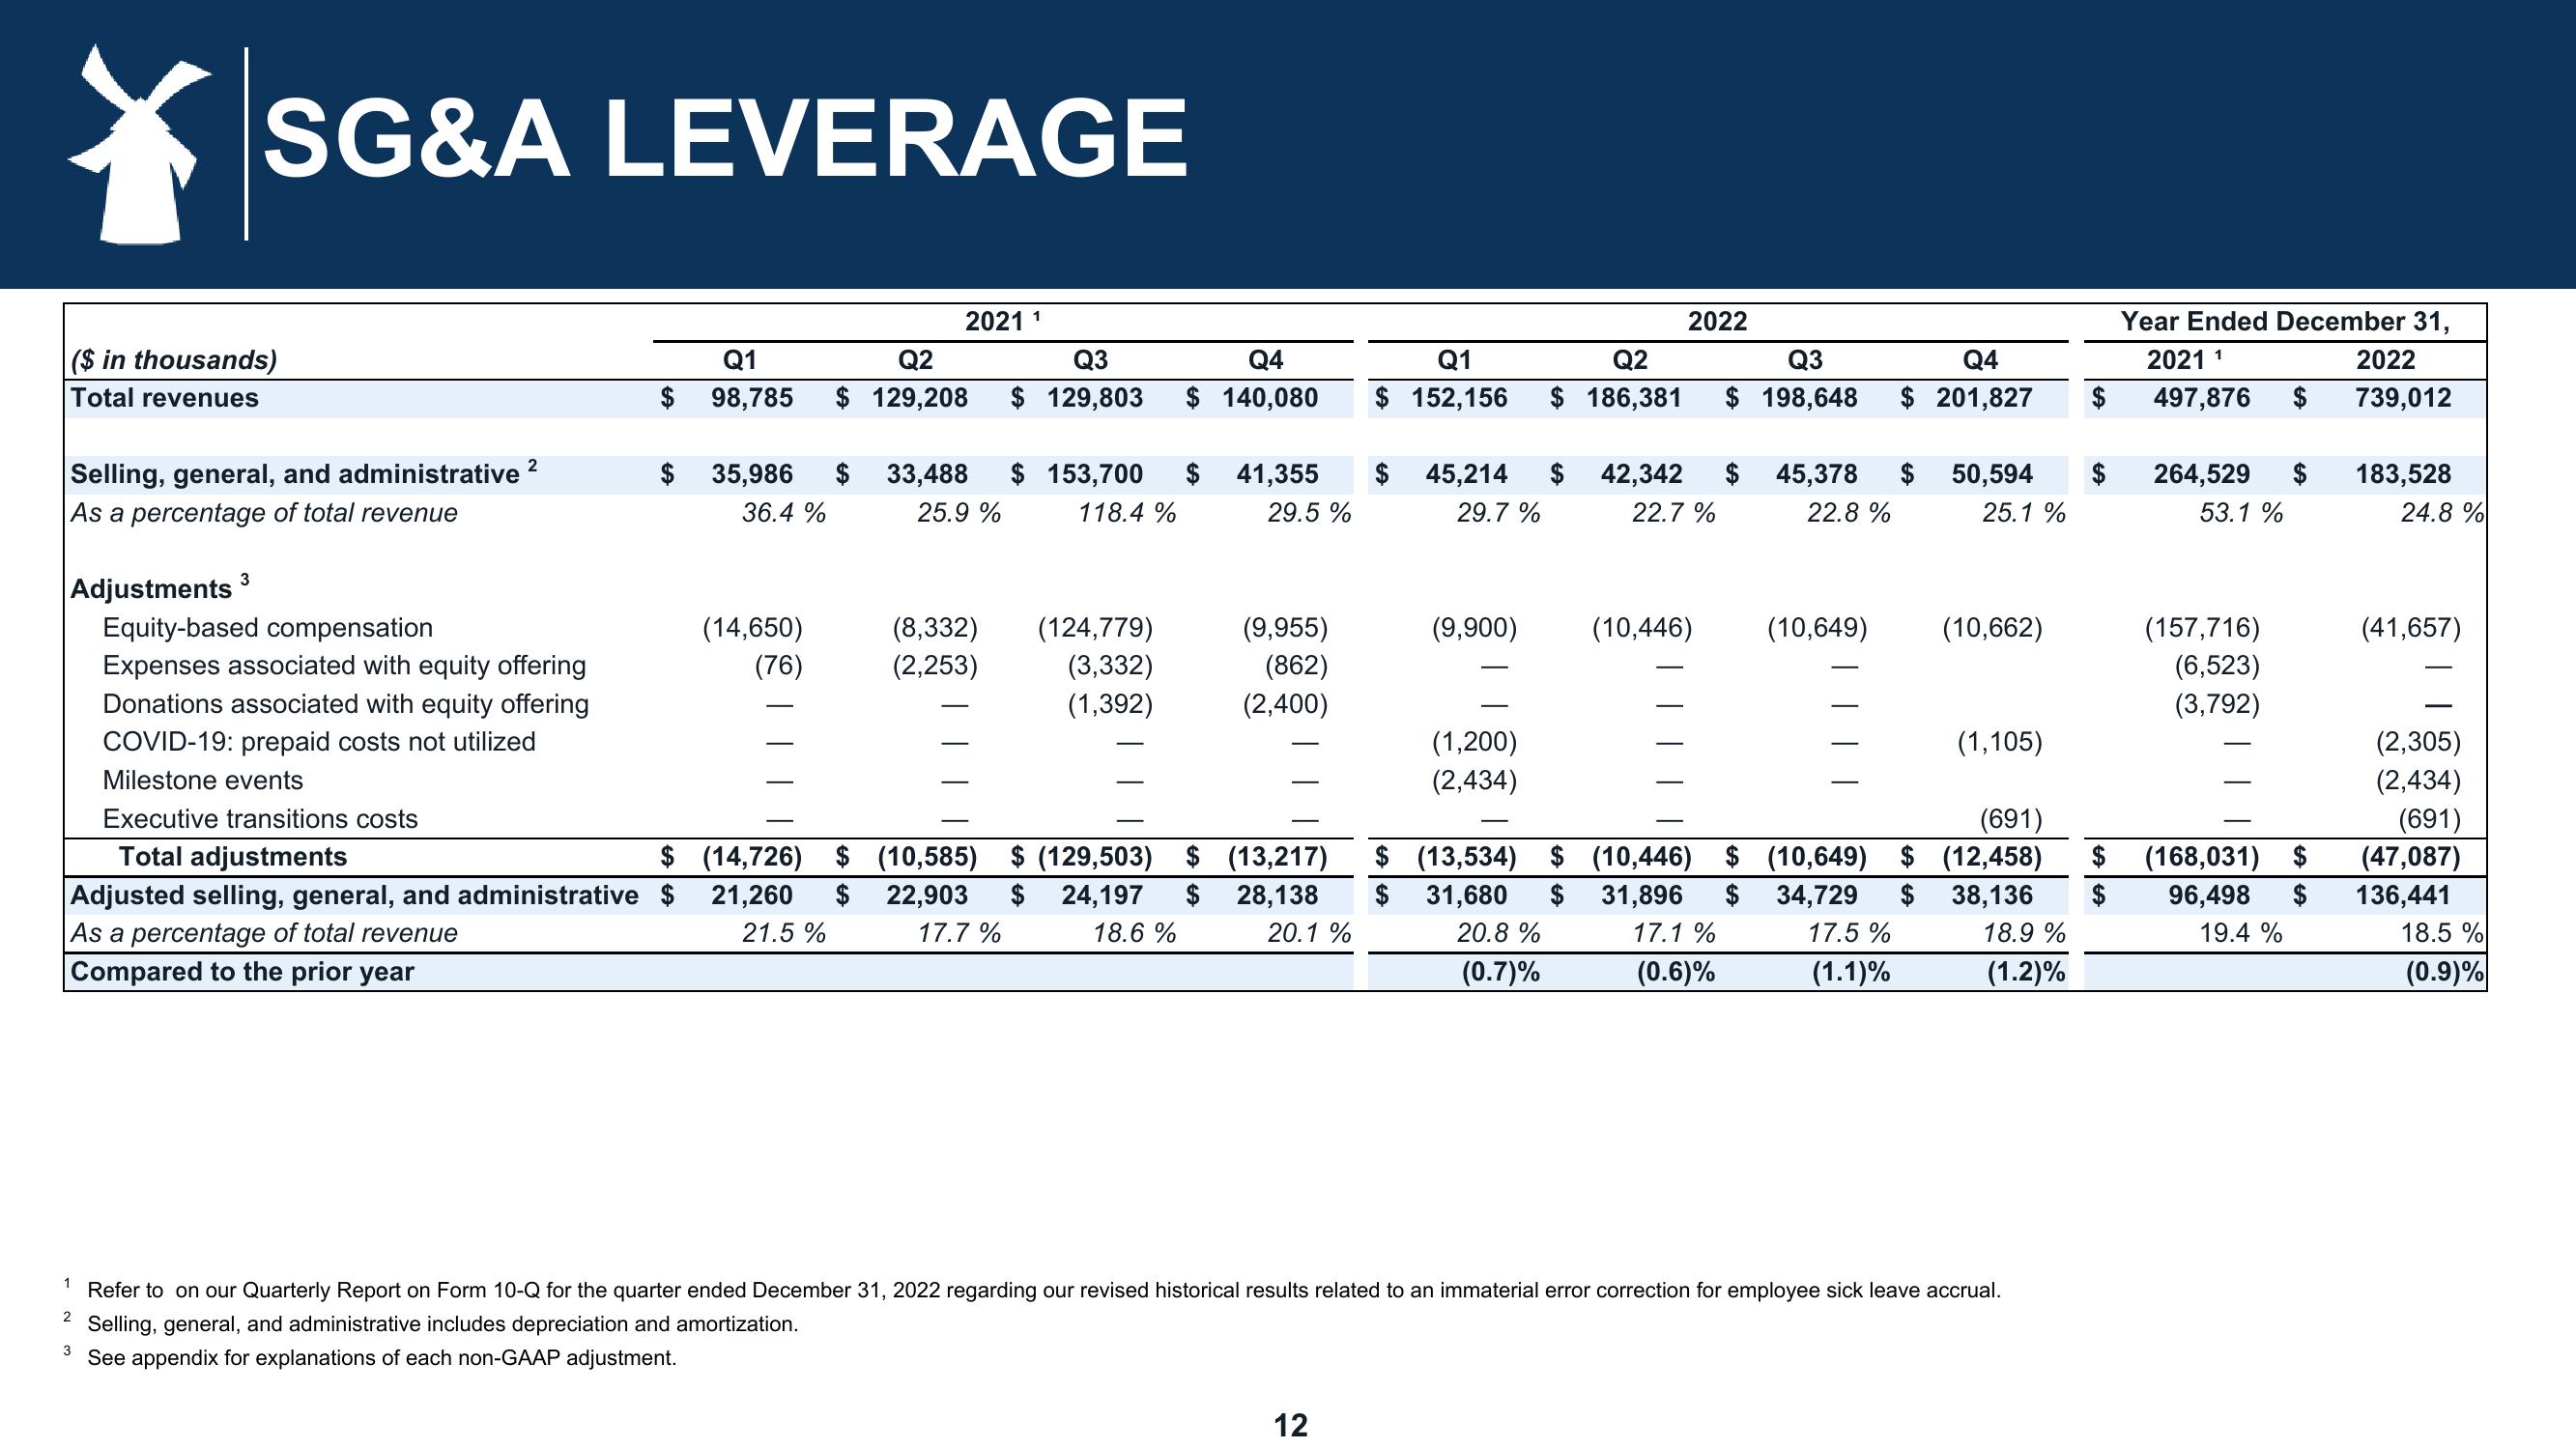
Refer to on our Quarterly Report on Form 10-Q for the quarter ended December 31, 2022 regarding our revised historical results related to an immaterial error correction for employee sick leave accrual.
Selling, general, and administrative includes depreciation and amortization.
3 See appendix for explanations of each non-GAAP adjustment.
$
$
Year Ended December 31,
2021 1
497,876 $
264,529 $
53.1 %
(157,716)
(6,523)
(3,792)
(168,031) $
96,498 $
19.4%
2022
739,012
183,528
24.8%
(41,657)
(2,305)
(2,434)
(691)
(47,087)
136,441
18.5 %
(0.9)%View entire presentation