Hagerty Investor Presentation Deck
MILLIONS
250
200
150
100
50
$ IN
THOUSANDS
holl
Q1 Q2 Q3 Q4 Q1 Q2 Q3 Q4 Q1 Q2 Q3 Q4 Q1 Q2 Q3 Q4 Q1 Q2 Q3 Q4
2018
2019
2020
2021
2022
2018
2019
2020
2021
2022
5 Year Average
Total Written
Premium %
Total Written Premium
Q1
82,514
96,732
112,421
133,707
154,790
20%
Q2
HISTORICAL SEASONALITY TRENDS
137,943
158,501
184,423
208,091
237,697
31%
Q3
123,385
142,030
163,520
192,091
222,136
29%
Q4
86,621
99,747
117,870
140,417
162,041
20%
Total
430,463
497,010
578,234
674,306
776,664
100%
THOUSANDS
90
80
70
60
50
40
30
20
10
New Business Count (Insurance)
Q1 Q2 Q3 Q4 Q1 Q2 Q3 Q4 Q1 Q2 Q3 Q4 Q1 Q2 Q3 Q4 Q1 Q2 Q3 Q4
2018
2019
2020
2021
2022
2018
2019
2020
2021
2022
5 Year Average
New Business
Count %
Q1
32,610
36,848
41,510
51,799
47,514
19%
Q2
56,729
62,842
70,622
77,013
74,922
32%
Q3
51,795
57,426
73,619
68,077
68,561
29%
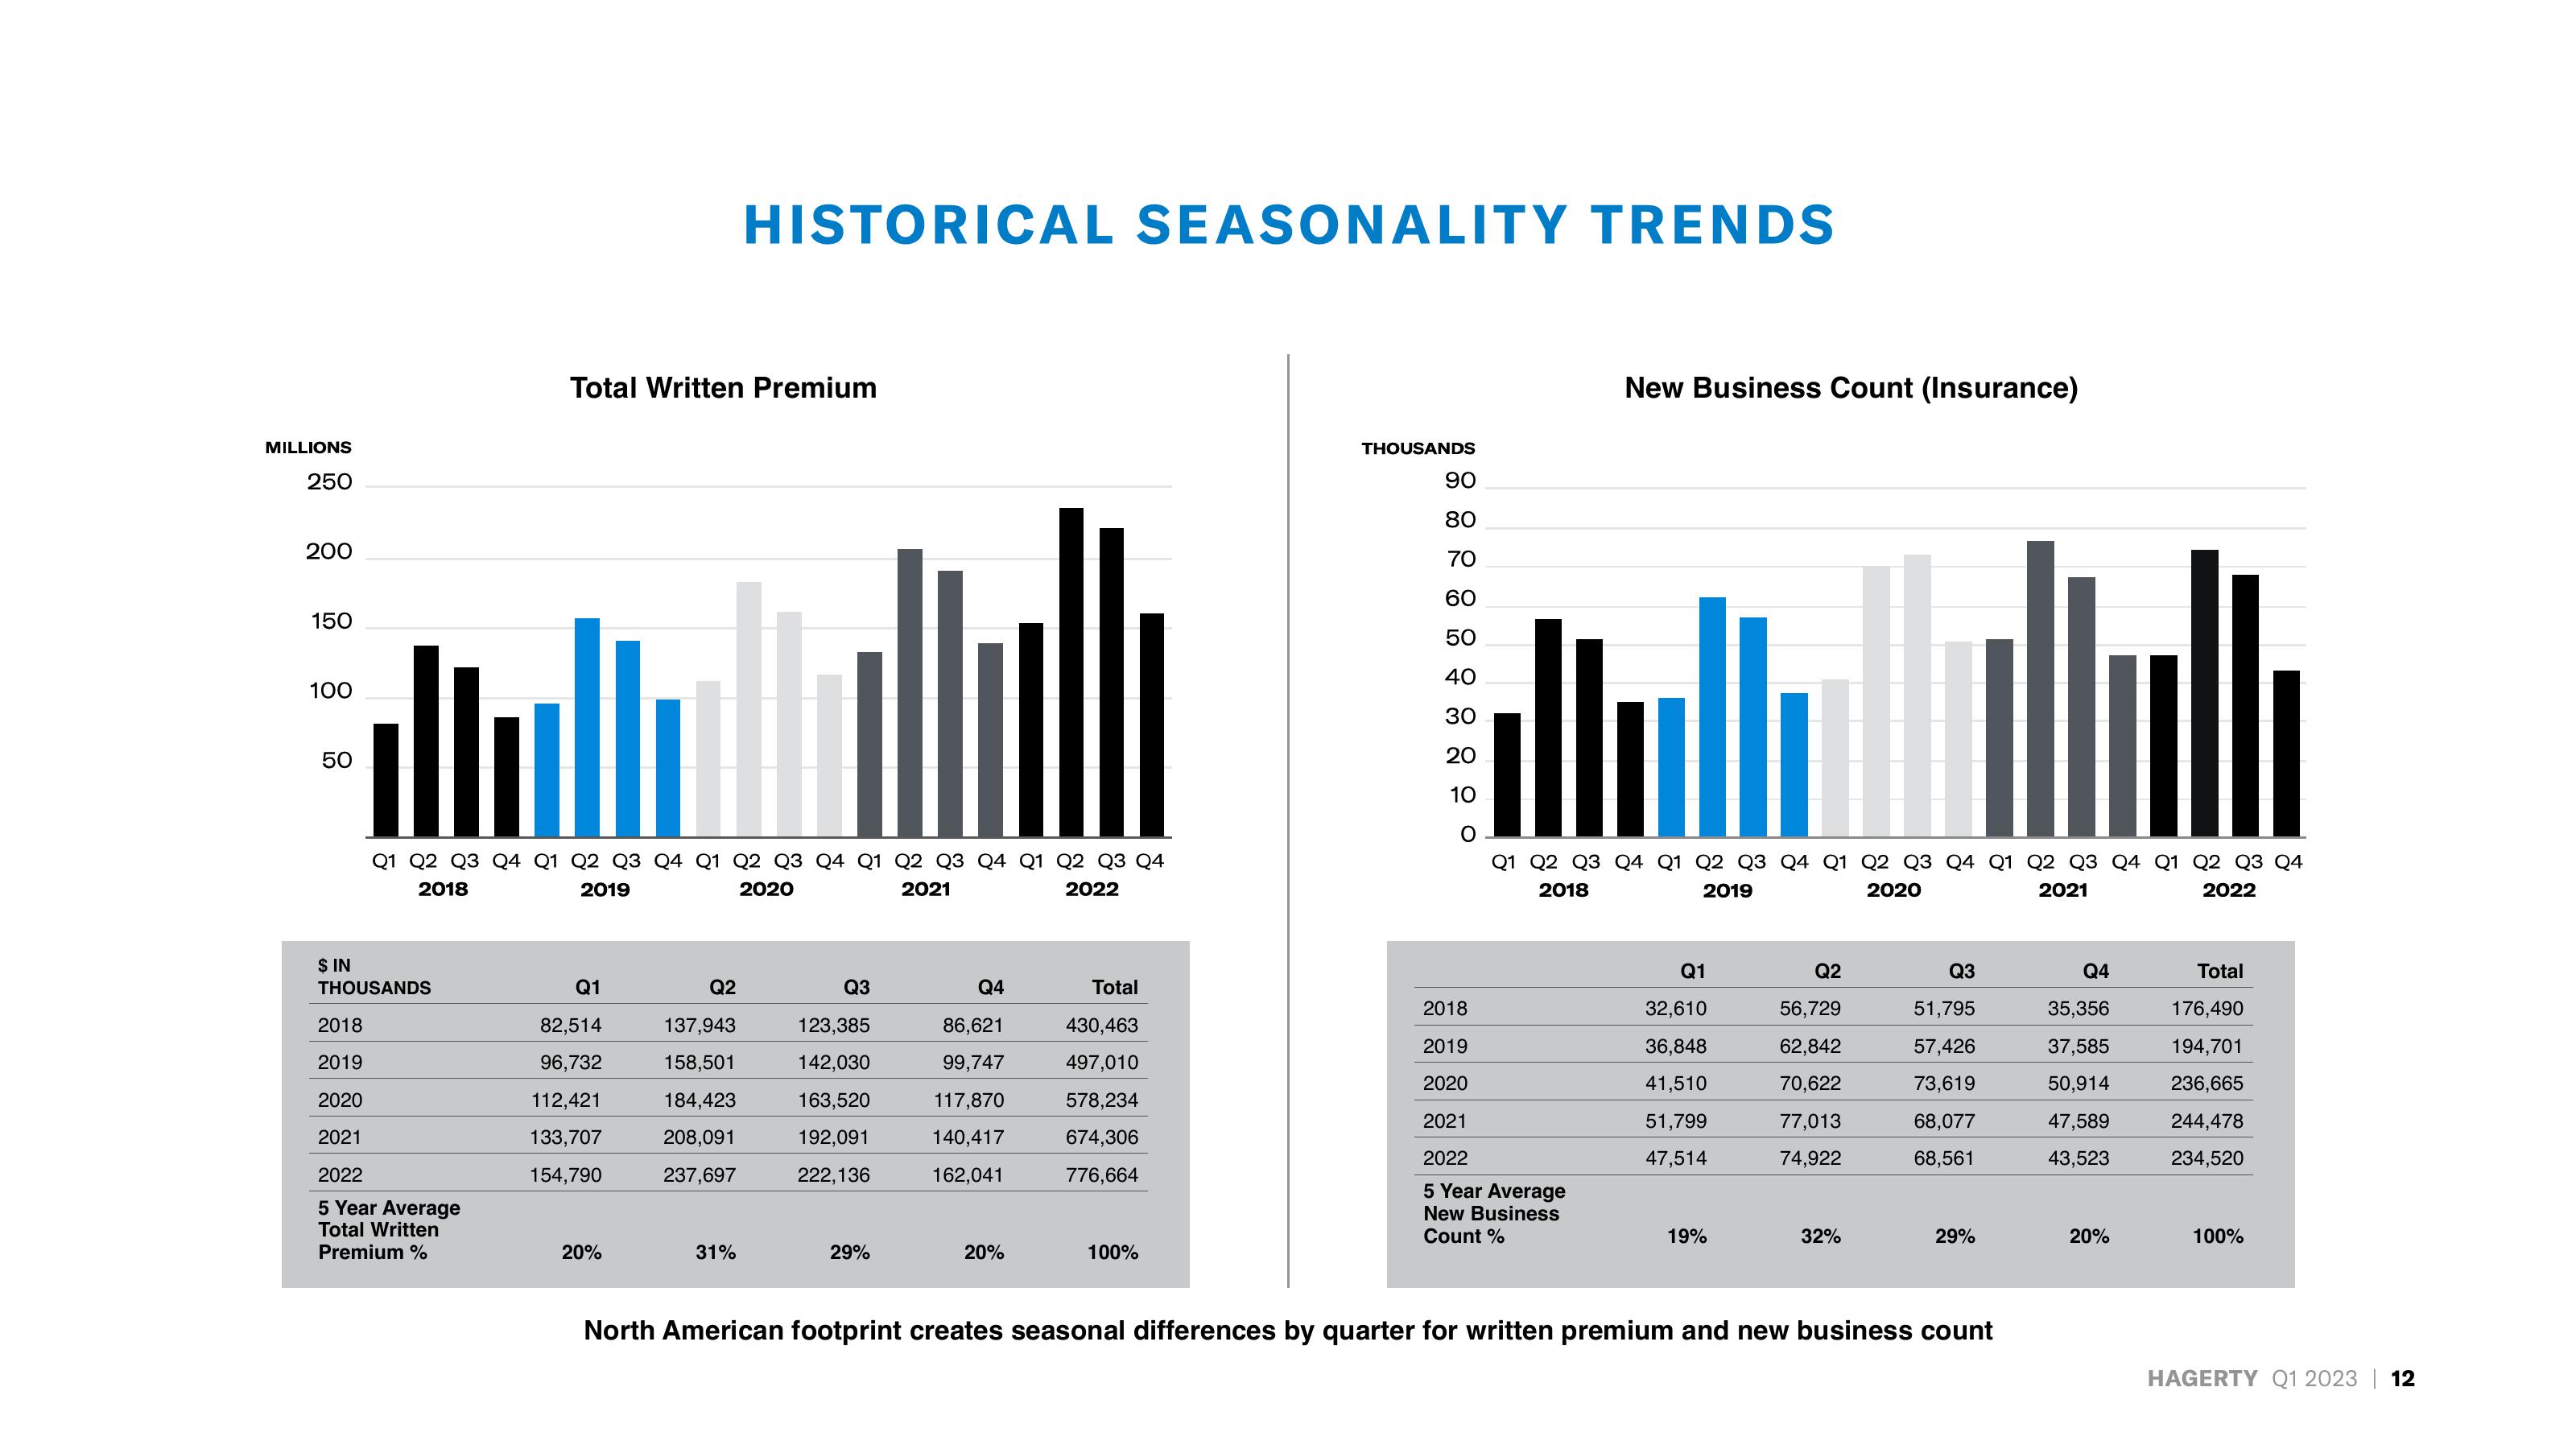
North American footprint creates seasonal differences by quarter for written premium and new business count
Q4
35,356
37,585
50,914
47,589
43,523
20%
Total
176,490
194,701
236,665
244,478
234,520
100%
HAGERTY Q1 2023 | 12View entire presentation