J.P.Morgan Results Presentation Deck
Corporate & Investment Bank1
Selected income statement data ($mm)
Revenue
Investment Banking revenue
Payments
Lending
Total Banking
Fixed Income Markets
Equity Markets
Securities Services
Credit Adjustments & Other
Total Markets & Securities Services
Expense
Credit costs
Net income²
Key drivers / statistics ($B)³
Equity
ROE
Overhead ratio
Comp/revenue
IB fees ($mm)
Average loans
Average client deposits 4
Merchant processing volume ($B)5
Assets under custody ($T)
6
ALL/EOP loans ex-conduits and trade
6
Net charge-off/(recovery) rate
Average VaR ($mm)
1 See note 1 on slide 11
2 See note 3 on slide 12
For additional footnotes see slide 13
3Q22
$11,875
1,713
1,989
323
4,025
4,469
2,302
1,110
(31)
7,850
6,618
513
$3,532
3Q22
$103.0
13%
56
28
$1,762
221.6
669.2
545.4
27.2
1.49%
0.04
$53
$ 0/(U)
2Q22
($72)
362
526
(87)
801
(242)
(777)
(41)
187
2Q22
$103.0
(295)
(16)
(139)
(873)
347
(127)
747
454
1,151
($193) ($2,115)
14%
56
29
3Q21
($521)
(1,312)
365
79
$1,650
218.0
722.4
539.6
28.6
1.38%
0.09
$52
(868)
797
3Q21
$83.0
26%
47
23
$3,297
203.5
714.4
470.9
32.0
1.29%
0.01
$33
LO
5
CCB
CIB
CB
AWM Corp.
Financial performance
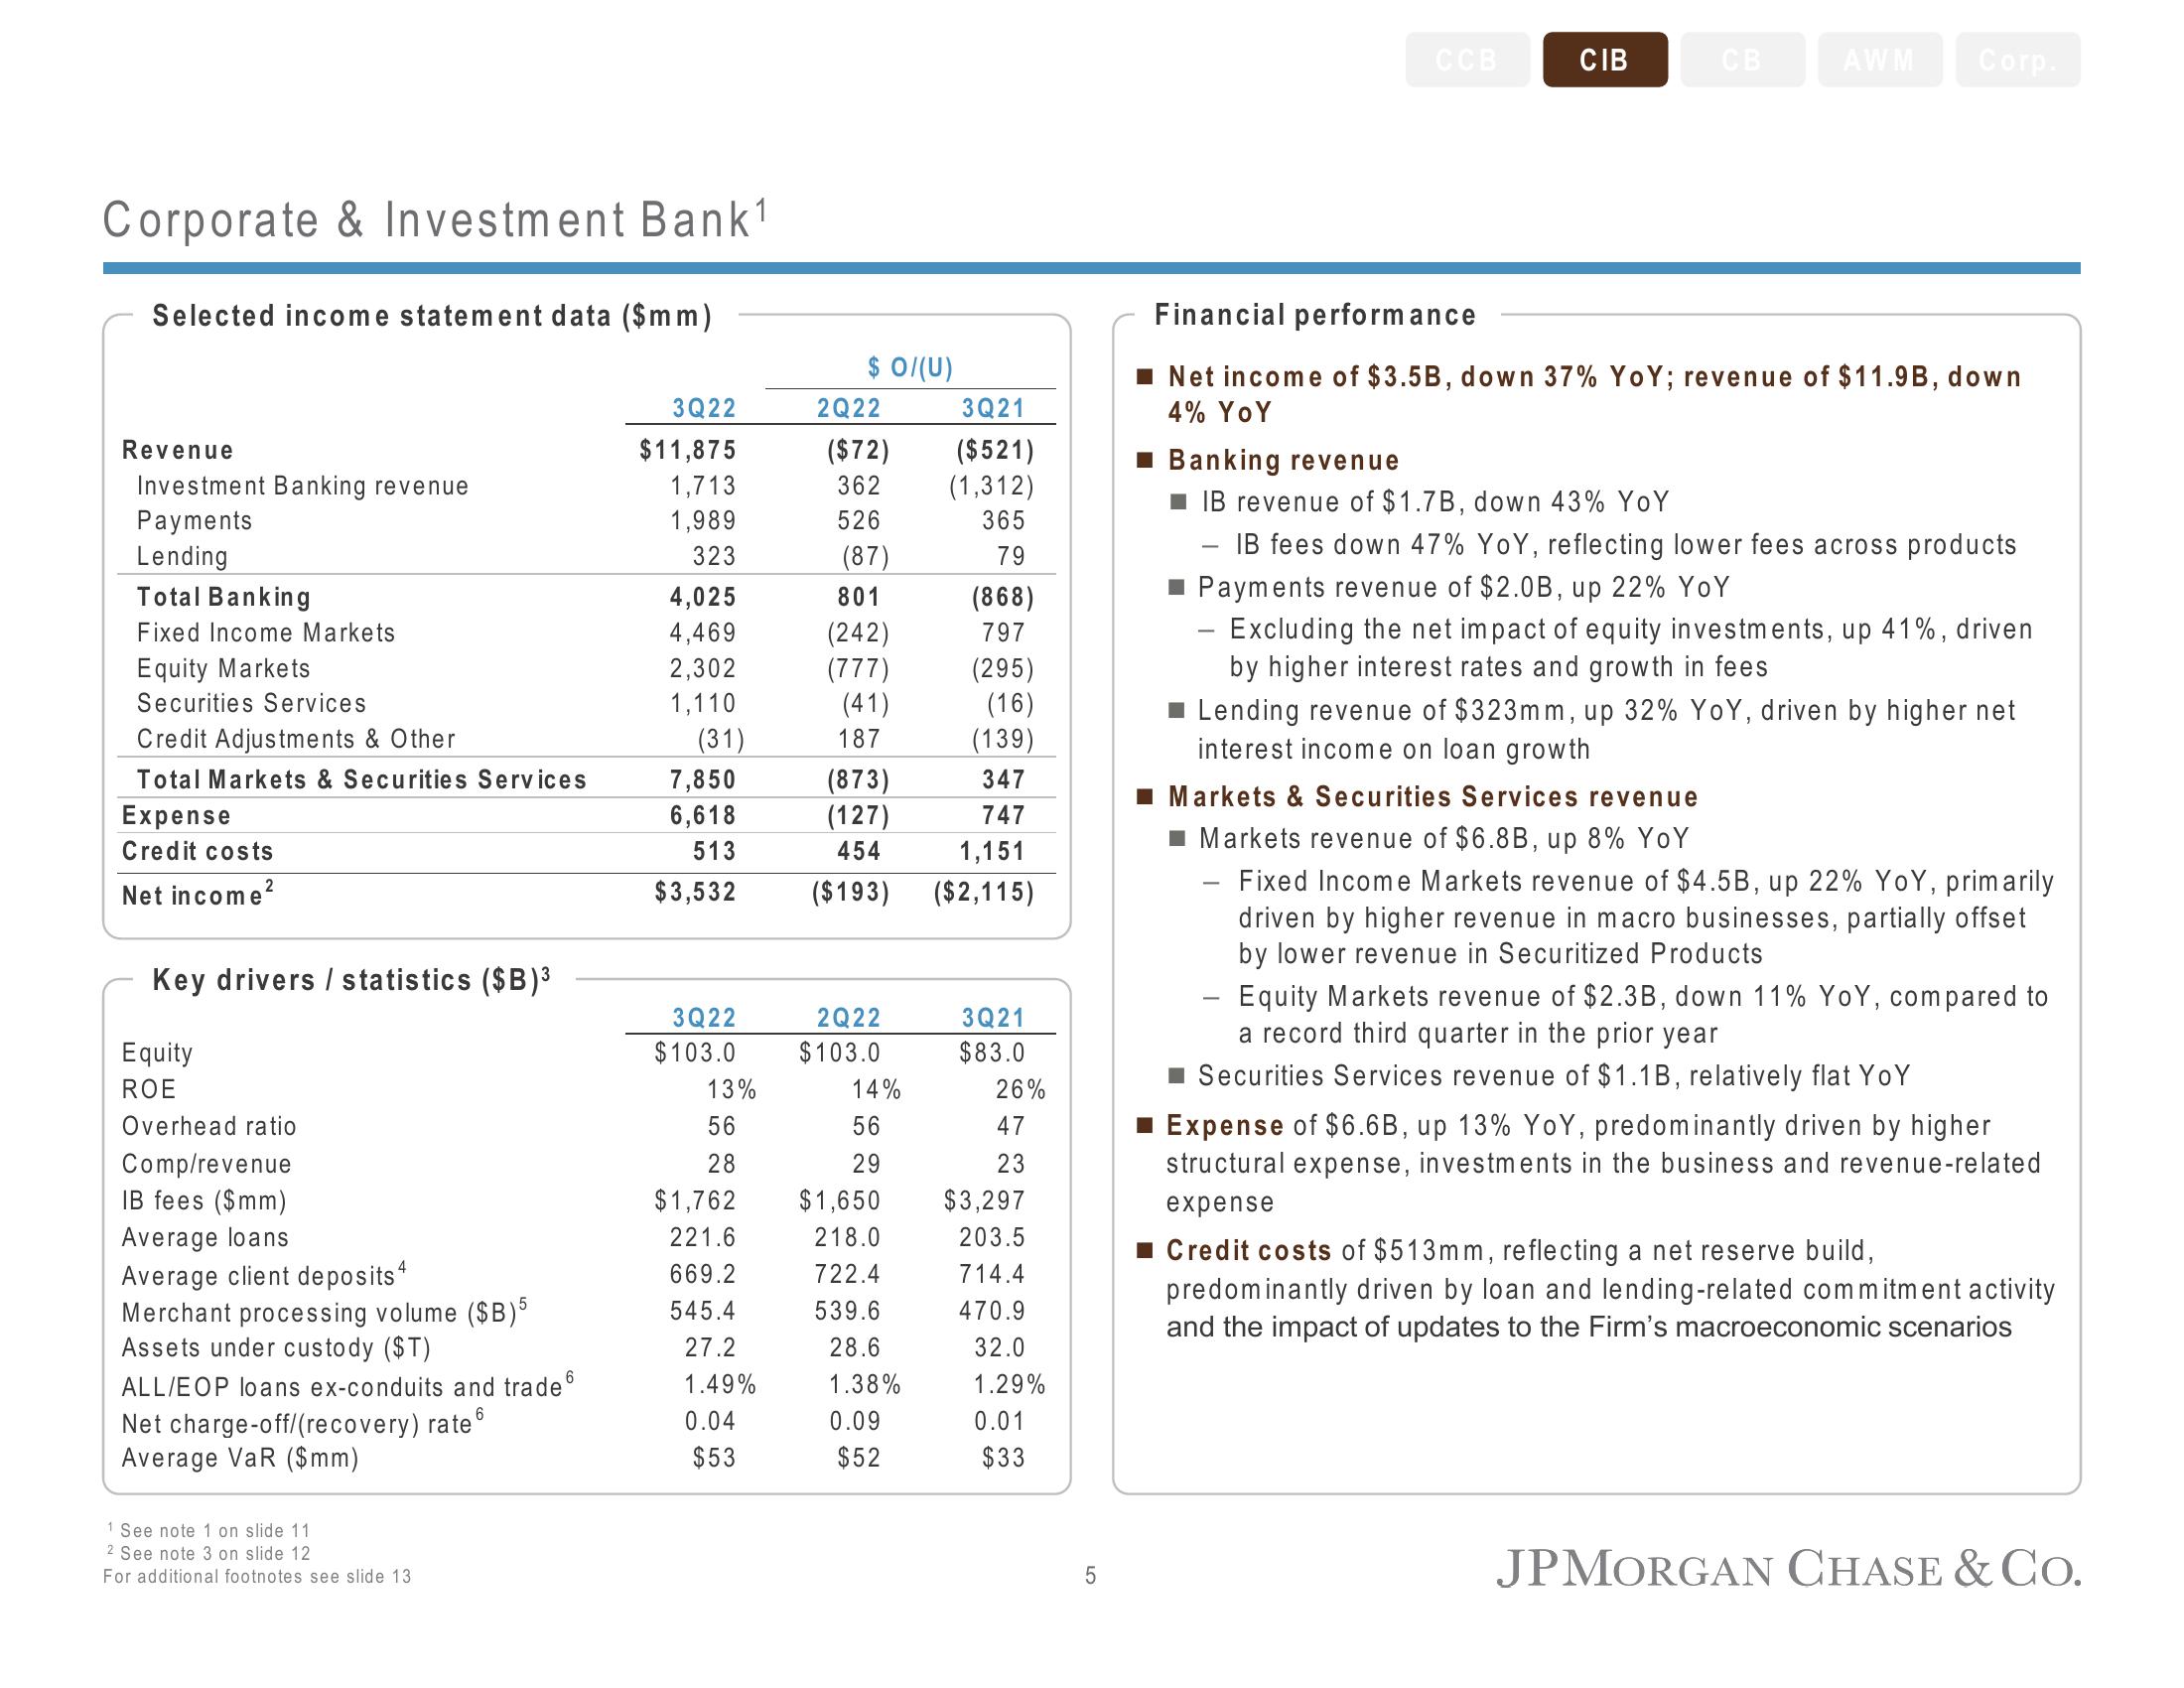
Net income of $3.5B, down 37% YoY; revenue of $11.9B, down
4% YoY
■ Banking revenue
■IB revenue of $1.7B, down 43% YoY
IB fees down 47% YoY, reflecting lower fees across products
■ Payments revenue of $2.0B, up 22% YoY
Excluding the net impact of equity investments, up 41%, driven
by higher interest rates and growth in fees
Lending revenue of $323mm, up 32% YoY, driven by higher net
interest income on loan growth
■ Markets & Securities Services revenue
■ Markets revenue of $6.8B, up 8% YoY
Fixed Income Markets revenue of $4.5B, up 22% YoY, primarily
driven by higher revenue in macro businesses, partially offset
by lower revenue in Securitized Products
Equity Markets revenue of $2.3B, down 11% YoY, compared to
a record third quarter in the prior year
■ Securities Services revenue of $1.1B, relatively flat YoY
■ Expense of $6.6B, up 13% YoY, predominantly driven by higher
structural expense, investments in the business and revenue-related
expense
■Credit costs of $513mm, reflecting a net reserve build,
predominantly driven by loan and lending-related commitment activity
and the impact of updates to the Firm's macroeconomic scenarios
JPMORGAN CHASE & Co.View entire presentation