Tudor, Pickering, Holt & Co Investment Banking
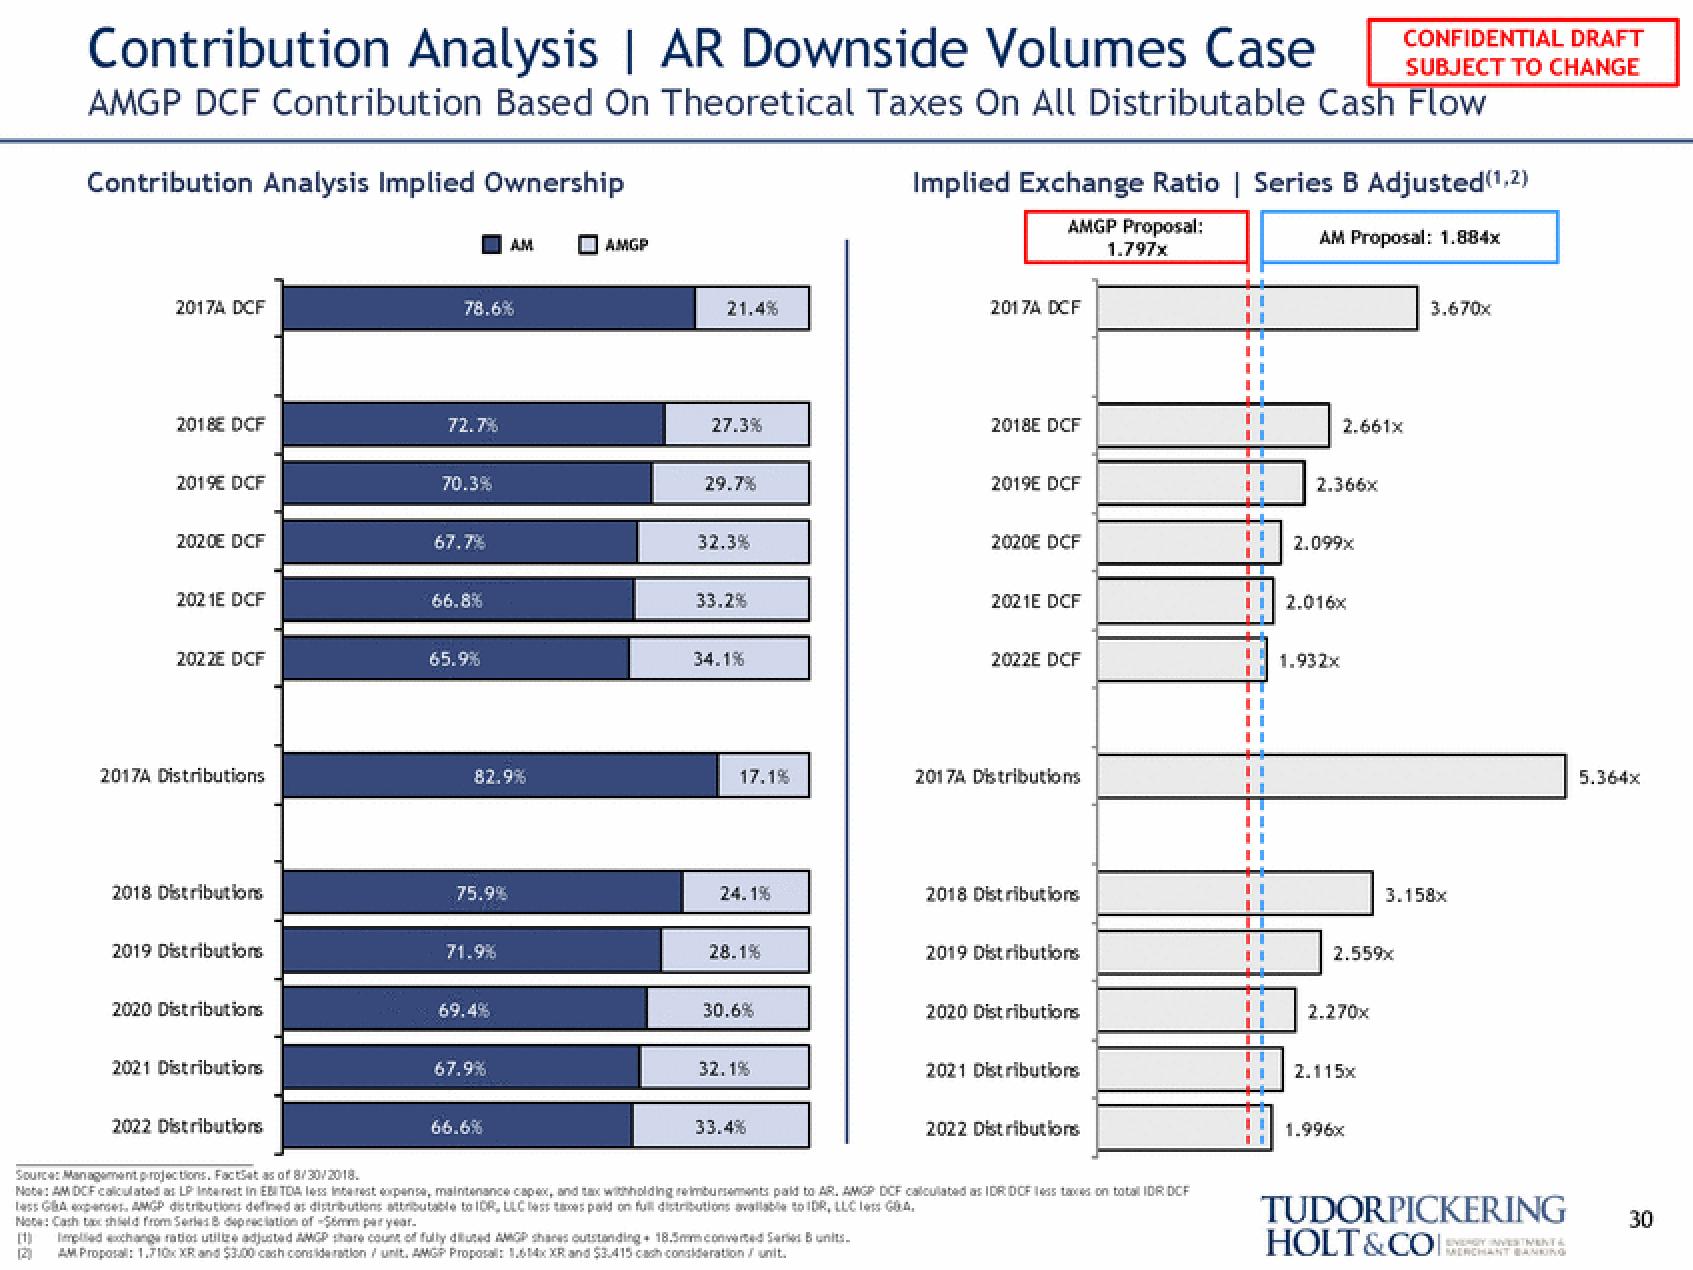
Contribution Analysis | AR Downside Volumes Case
AMGP DCF Contribution Based On Theoretical Taxes On All Distributable Cash Flow
Contribution Analysis Implied Ownership
2017A DCF
2018E DCF
2019E DCF
2020E DCF
2021E DCF
2022E DCF
2017A Distributions
2018 Distributions
2019 Distributions
2020 Distributions
2021 Distributions
2022 Distributions
78.6%
72.7%
70.3%
67.7%
66.8%
65.9%
82.9%
75.9%
71.9%
AM
69.4%
67.9%
66.65
AMGP
21.4%
27.3%
29.7%
32.3%
33.2%
34.1%
17.1%
24.1%
28.1%
30.6%
32.1%
33.4%
Implied Exchange Ratio | Series B Adjusted (1,2)
AMGP Proposal:
1.797x
2017A DCF
2018E DCF
2019E DCF
2020E DCF
2021E DCF
2022E DCF
2017A Distributions
2018 Distributions
2019 Distributions
2020 Distributions
2021 Distributions
2022 Distributions
Sources Management projections. FactSet as of 8/30/2018.
Note: AM DCF calculated as LP Interest in EBITDA less interest expense, maintenance capex, and tax withholding reimbursements paid to AR. AMGP DCF calculated as IDR DCF less taxes on totall IDR DCF
less GBA expenses AMGP distributions defined as distributions attributable to IDR, LLC les taxes paid on full distributions available to IDR, LLC less GOA.
Note: Cach taxxshield from Series 8 depreciation of Som per year.
(12)
Imped exchange ratios utilize adjusted AMGP share count of fully diluted AMGP shares outstanding 18.5mm converted Series 5 units.
AM Proposal: 1.710x XR and $3.00 cash consideration / unit. AMGP Proposal: 1.614x XR and $3.415 cach consideration / unit.
I
| |
H
HI
I
II
"
11
I
I
U
11
II
I
I
I
AM Proposal: 1.884x
2.366x
2.661x
2.099x
2.016x
1.932x
2.559x
2.270x
CONFIDENTIAL DRAFT
SUBJECT TO CHANGE
2.115x
1.996x
3.670x
3.158x
TUDORPICKERING
HOLT&COI:
EVERGY INVESTMENT &
MERCHANT BANKING
5.364x
30View entire presentation