E2open Results Presentation Deck
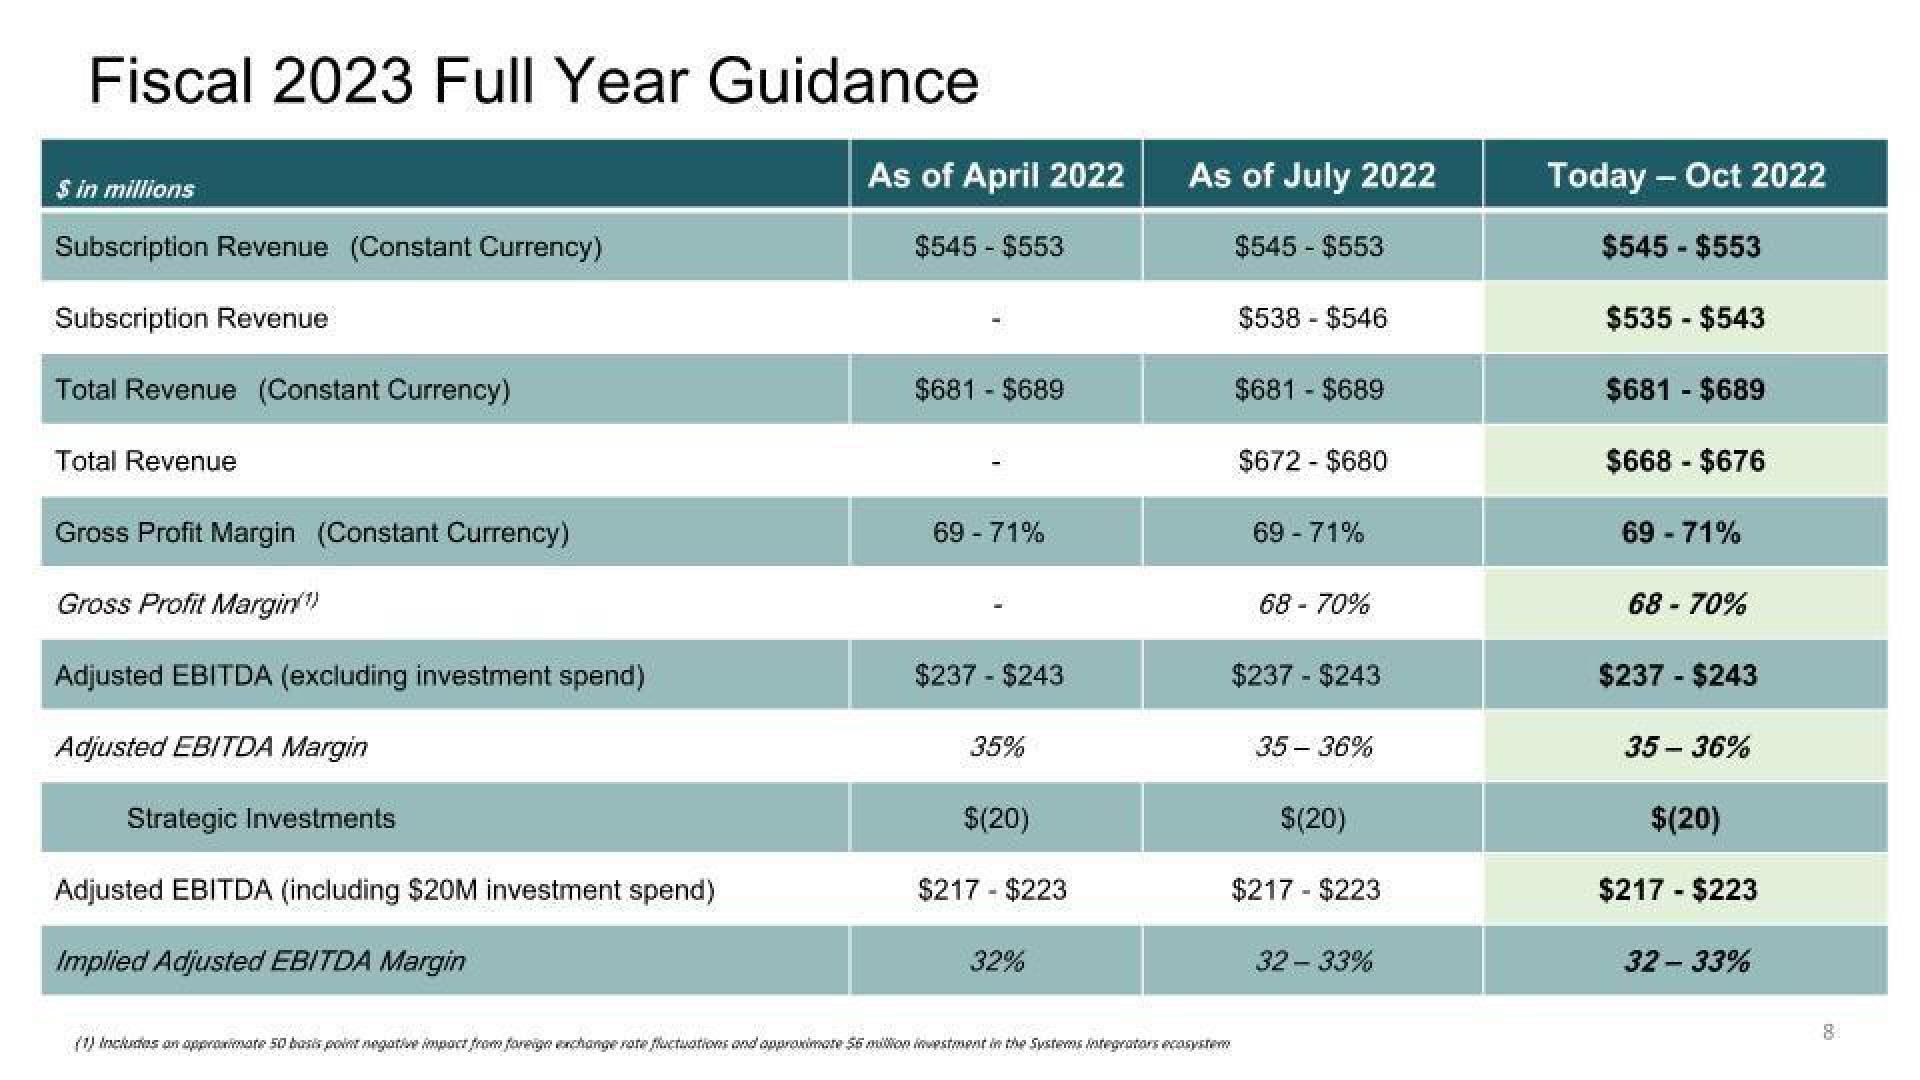
Fiscal 2023 Full Year Guidance
$ in millions
Subscription Revenue (Constant Currency)
Subscription Revenue
Total Revenue (Constant Currency)
Total Revenue
Gross Profit Margin (Constant Currency)
Gross Profit Margin(¹)
Adjusted EBITDA (excluding investment spend)
Adjusted EBITDA Margin
Strategic Investments
Adjusted EBITDA (including $20M investment spend)
Implied Adjusted EBITDA Margin
As of April 2022
$545 - $553
$681 $689
69 - 71%
$237 - $243
35%
$(20)
$217 - $223
32%
As of July 2022
$545 - $553
(1) Includes on approximate 50 basis point negative impact from foreign exchange rate fluctuations and approximate $6 million investment in the Systems Integrators ecosystem
$538 - $546
$681 - $689
$672 - $680
69 - 71%
68 - 70%
$237 - $243
35 - 36%
$(20)
$217 - $223
32 - 33%
Today - Oct 2022
$545 - $553
$535 - $543
$681 - $689
$668 - $676
69 - 71%
68 - 70%
$237 - $243
35-36%
$(20)
$217 - $223
32 -33%
8View entire presentation