Goldman Sachs Results Presentation Deck
Capital and Balance Sheet
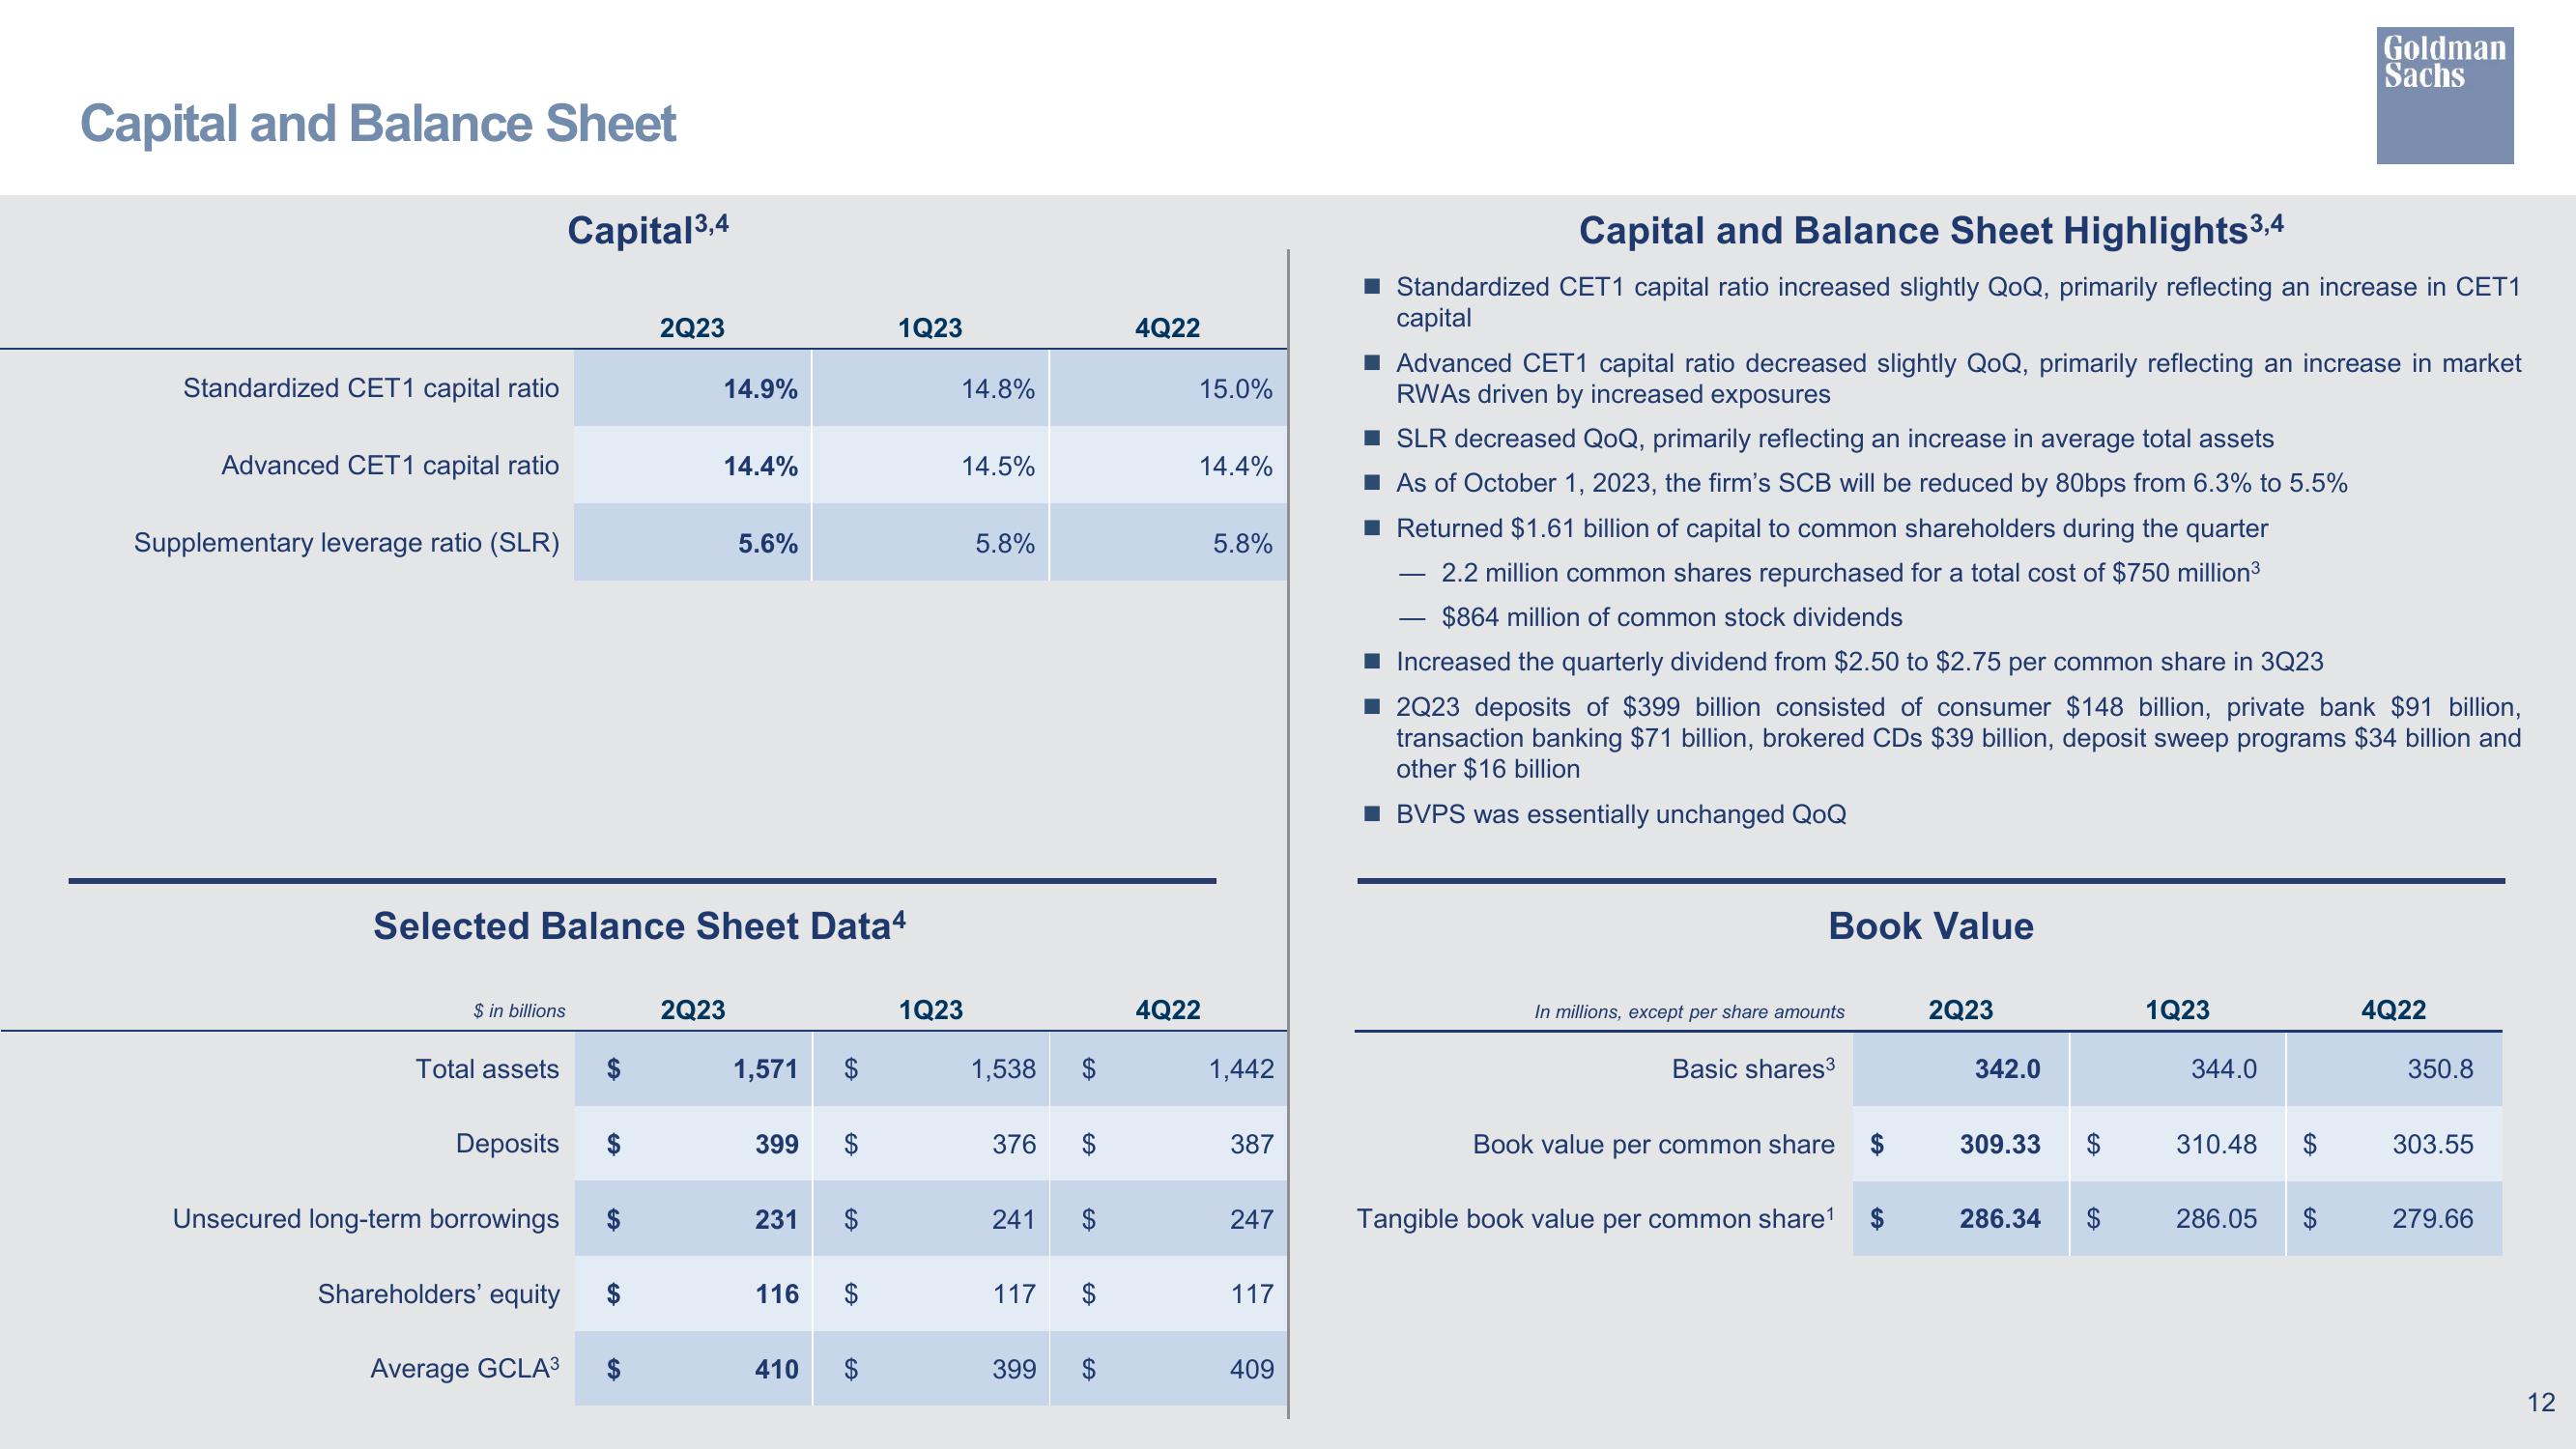
Capital ³,4
Standardized CET1 capital ratio
Advanced CET1 capital ratio
Supplementary leverage ratio (SLR)
$ in billions
Total assets
Deposits
Unsecured long-term borrowings
Selected Balance Sheet Data4
Shareholders' equity
Average GCLA³
2Q23
SA
14.9%
14.4%
5.6%
2Q23
1,571
399
231
116
410
GA
SA
1Q23
SA
14.8%
14.5%
1Q23
5.8%
1,538 $
376
241
117
399
SA
SA
4Q22
15.0%
14.4%
4Q22
5.8%
1,442
387
247
117
409
Capital and Balance Sheet Highlights 3,4
Standardized CET1 capital ratio increased slightly QoQ, primarily reflecting an increase in CET1
capital
■ Advanced CET1 capital ratio decreased slightly QoQ, primarily reflecting an increase in market
RWAS driven by increased exposures
■ SLR decreased QoQ, primarily reflecting an increase in average total assets
■ As of October 1, 2023, the firm's SCB will be reduced by 80bps from 6.3% to 5.5%
■ Returned $1.61 billion of capital to common shareholders during the quarter
2.2 million common shares repurchased for a total cost of $750 million³
$864 million of common stock dividends
Increased the quarterly dividend from $2.50 to $2.75 per common share in 3Q23
2Q23 deposits of $399 billion consisted of consumer $148 billion, private bank $91 billion,
transaction banking $71 billion, brokered CDs $39 billion, deposit sweep programs $34 billion and
other $16 billion
BVPS was essentially unchanged QoQ
Book Value
In millions, except per share amounts
Basic shares³
Book value per common share
Tangible book value per common share¹
2Q23
342.0
309.33
286.34
1Q23
344.0
310.48
Goldman
Sachs
286.05
$
4Q22
350.8
303.55
279.66
12View entire presentation