Clover Health SPAC Presentation Deck
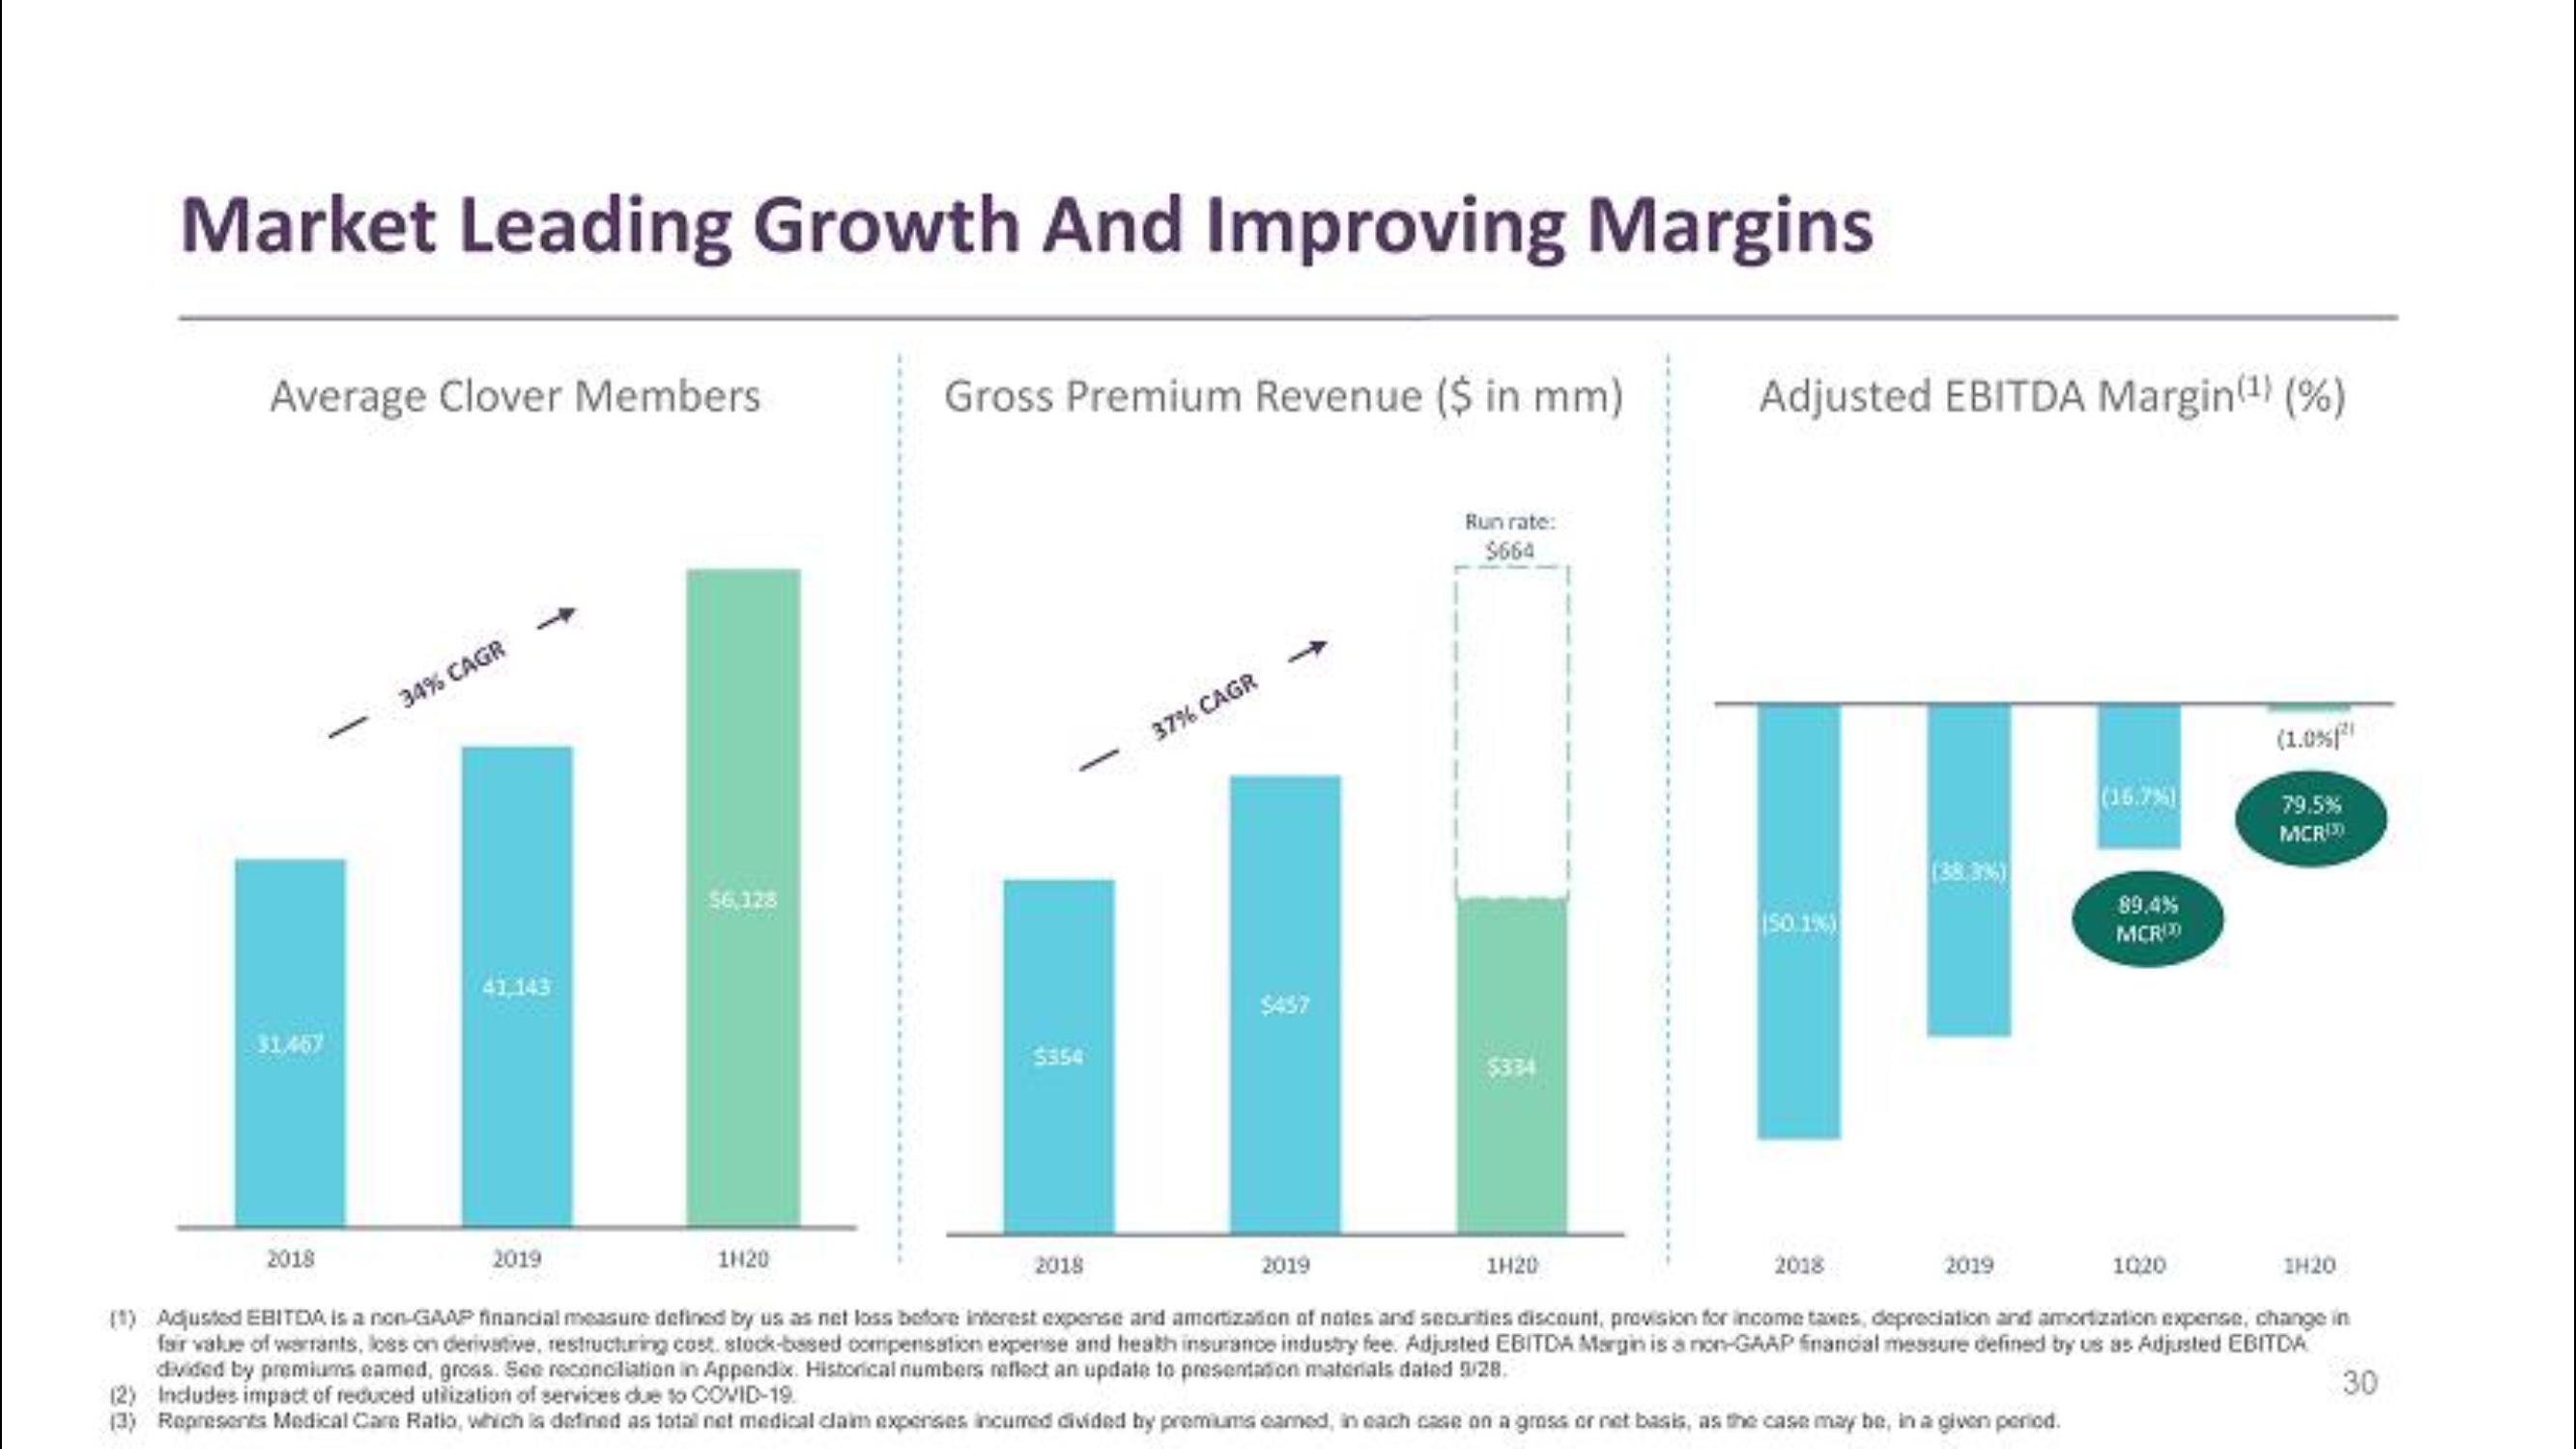
Market Leading Growth And Improving Margins
Average Clover Members
31.457
2018
34% CAGR
41,143
2019
$6,328
22
1H20
Gross Premium Revenue ($ in mm)
Run rate:
$664
37% CAGR
1
$354
$334
1H20
Adjusted EBITDA Margin(¹) (%)
(50.1%)
2019
(15.7%)
89.4%
MCR
1020
(1.0% ²
79.5%
MCRI)
2018
2019
2018
1H20
(1) Adjusted EBITDA is a non-GAAP financial measure defined by us as net loss before interest expense and amortization of notes and securities discount, provision for income taxes, depreciation and amortization expense, change in
fair value of warrants, loss on derivative, restructuring cost. stock-based compensation expense and health insurance industry fee. Adjusted EBITDA Margin is a non-GAAP financial messure defined by us as Adjusted EBITDA
divided by premiums eamed, gross. See reconciliation in Appendix. Historical numbers reflect an update to presentation materials dated 9/28.
30
(2) Includes impact of reduced utilization of services due to COVID-19.
(3) Represents Medical Care Ratio, which is defined as total net medical claim expenses incurred divided by premiums earned, in each case on a gross or net basis, as the case may be, in a given period.View entire presentation