Bed Bath & Beyond Results Presentation Deck slide image

Bed Bath & Beyond Results Presentation Deck

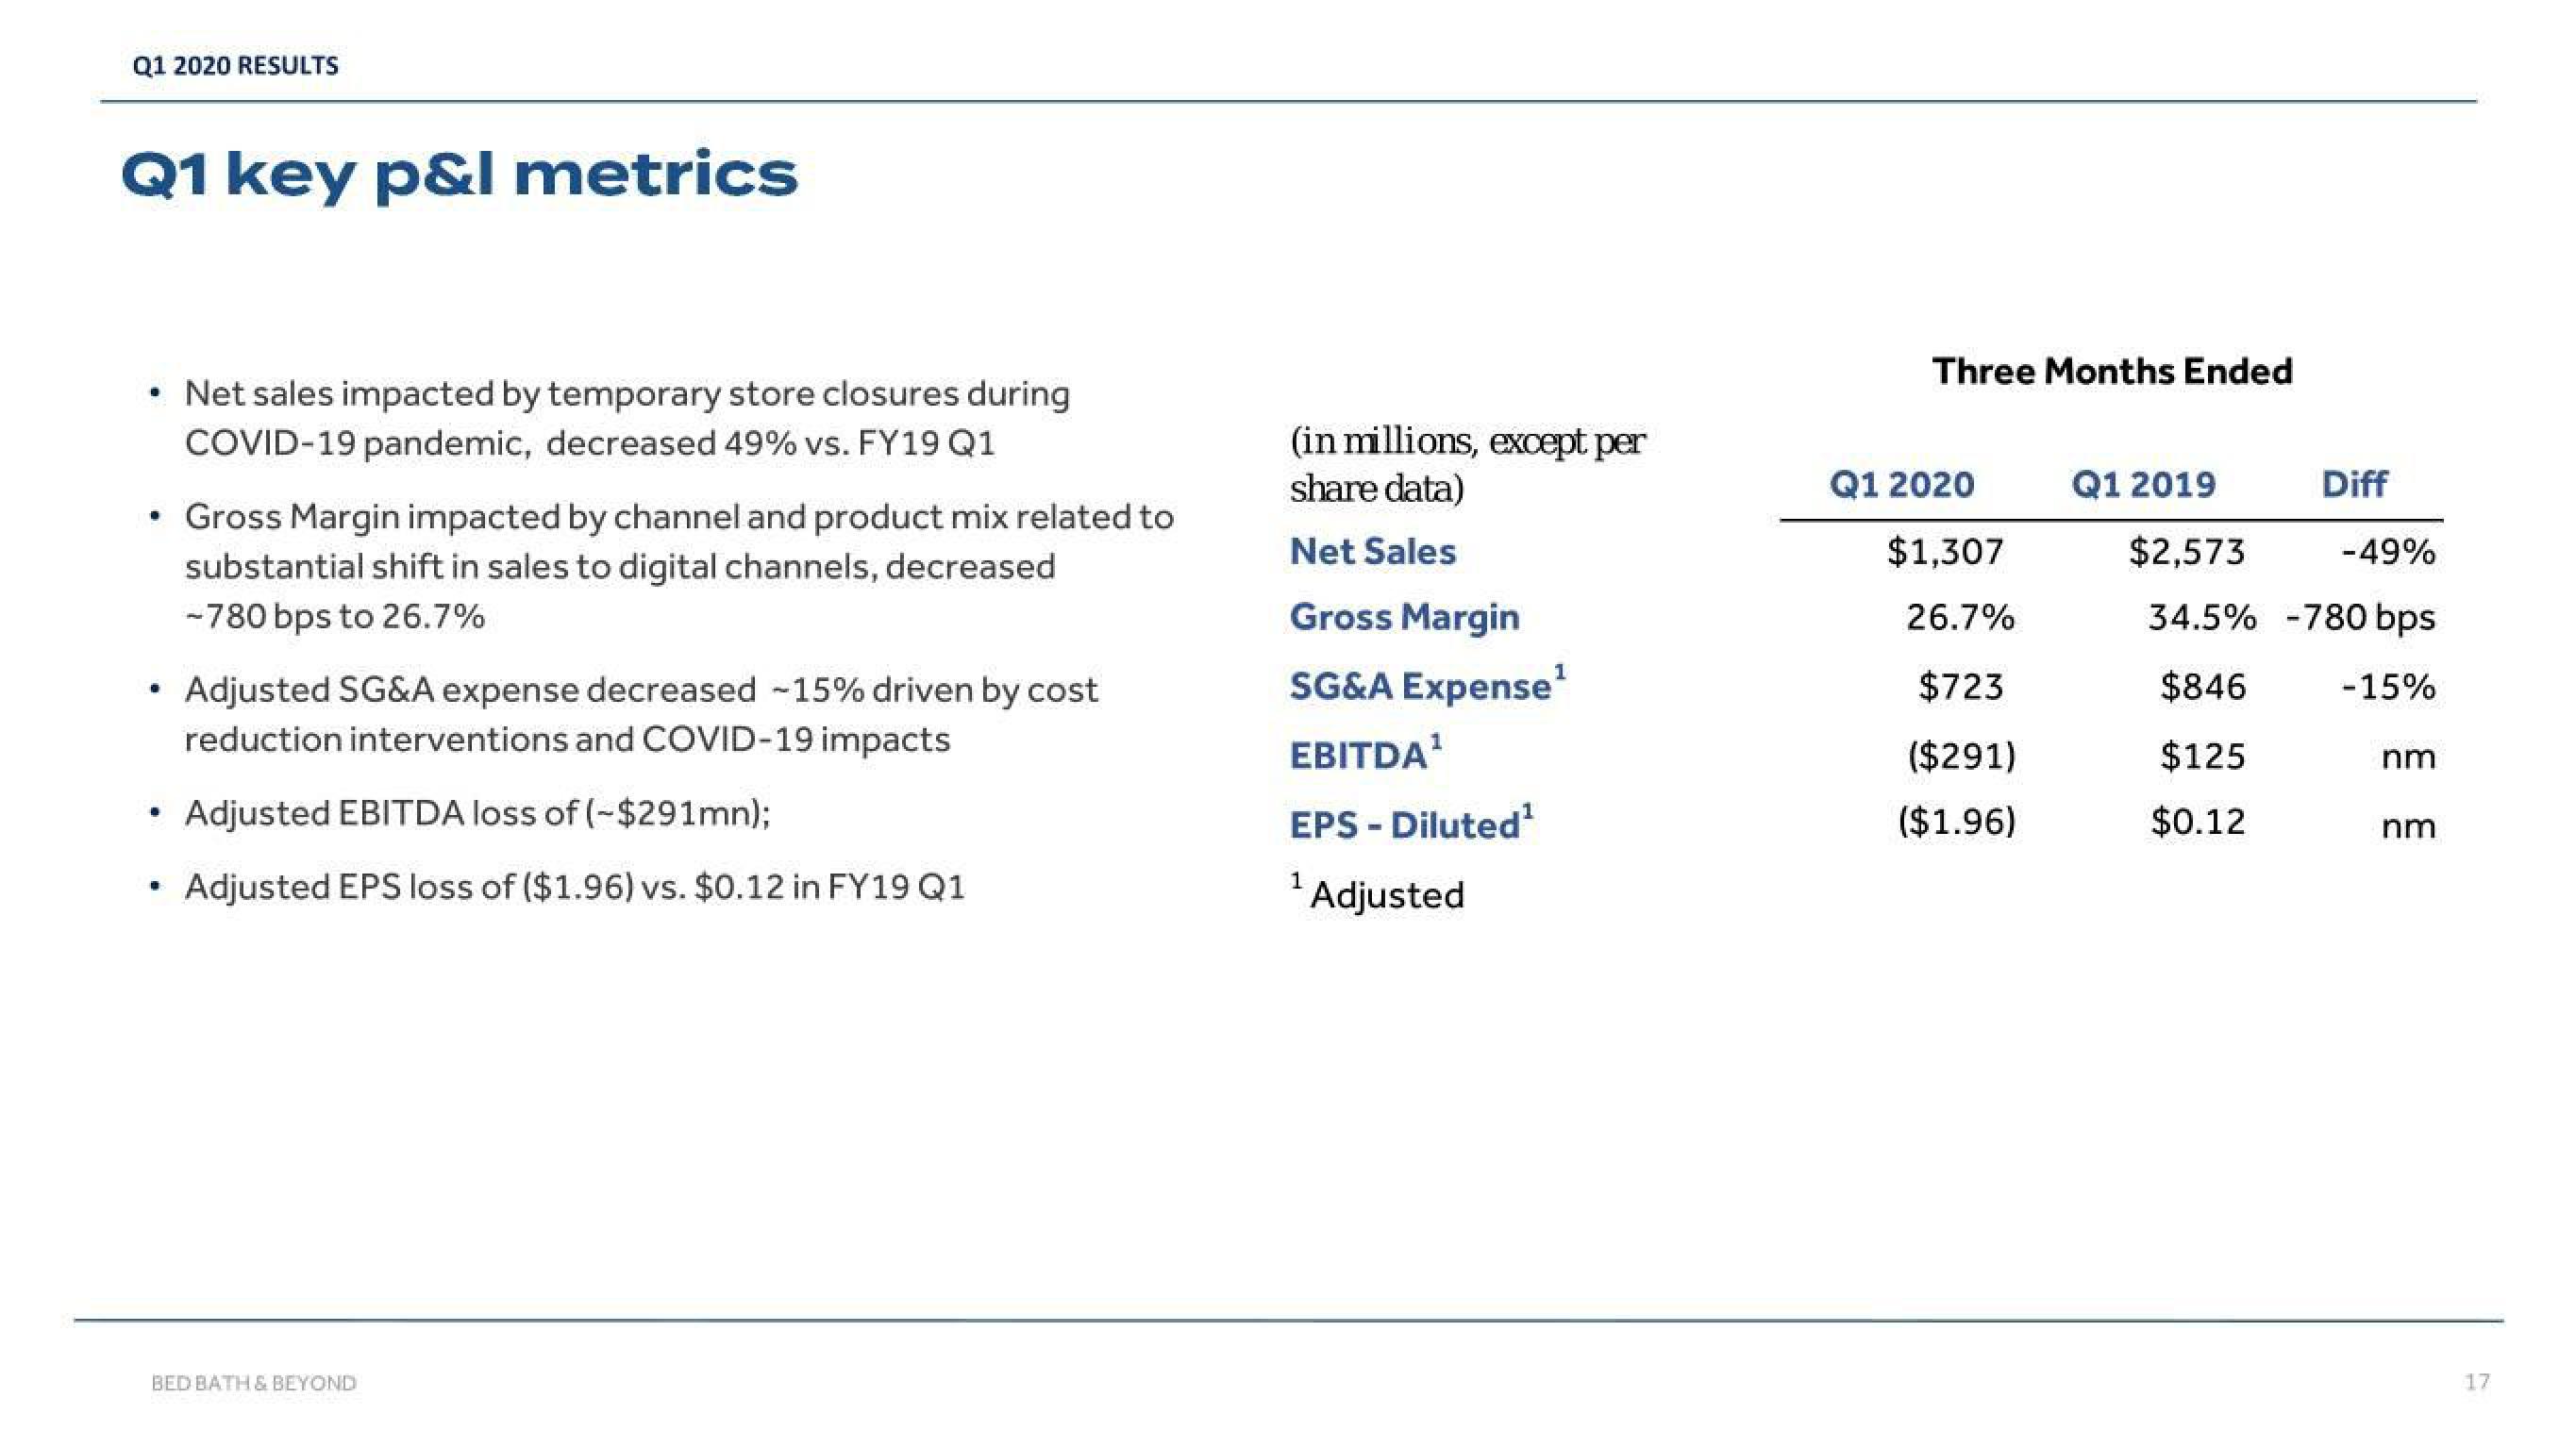
Q1 2020 RESULTS Q1 key p&l metrics • Net sales impacted by temporary store closures during COVID-19 pandemic, decreased 49% vs. FY19 Q1 · • 1 Gross Margin impacted by channel and product mix related to substantial shift in sales to digital channels, decreased -780 bps to 26.7% Adjusted SG&A expense decreased -15% driven by cost reduction interventions and COVID-19 impacts Adjusted EBITDA loss of (-$291mn); Adjusted EPS loss of ($1.96) vs. $0.12 in FY19 Q1 BED BATH & BEYOND (in millions, except per share data) Net Sales Gross Margin SG&A Expense¹ EBITDA¹ EPS - Diluted¹ Adjusted Three Months Ended Q1 2020 $1,307 26.7% $723 ($291) ($1.96) Q1 2019 Diff $2,573 -49% 34.5% -780 bps $846 -15% $125 $0.12 nm nm 17
View entire presentation