Cyxtera SPAC Presentation Deck
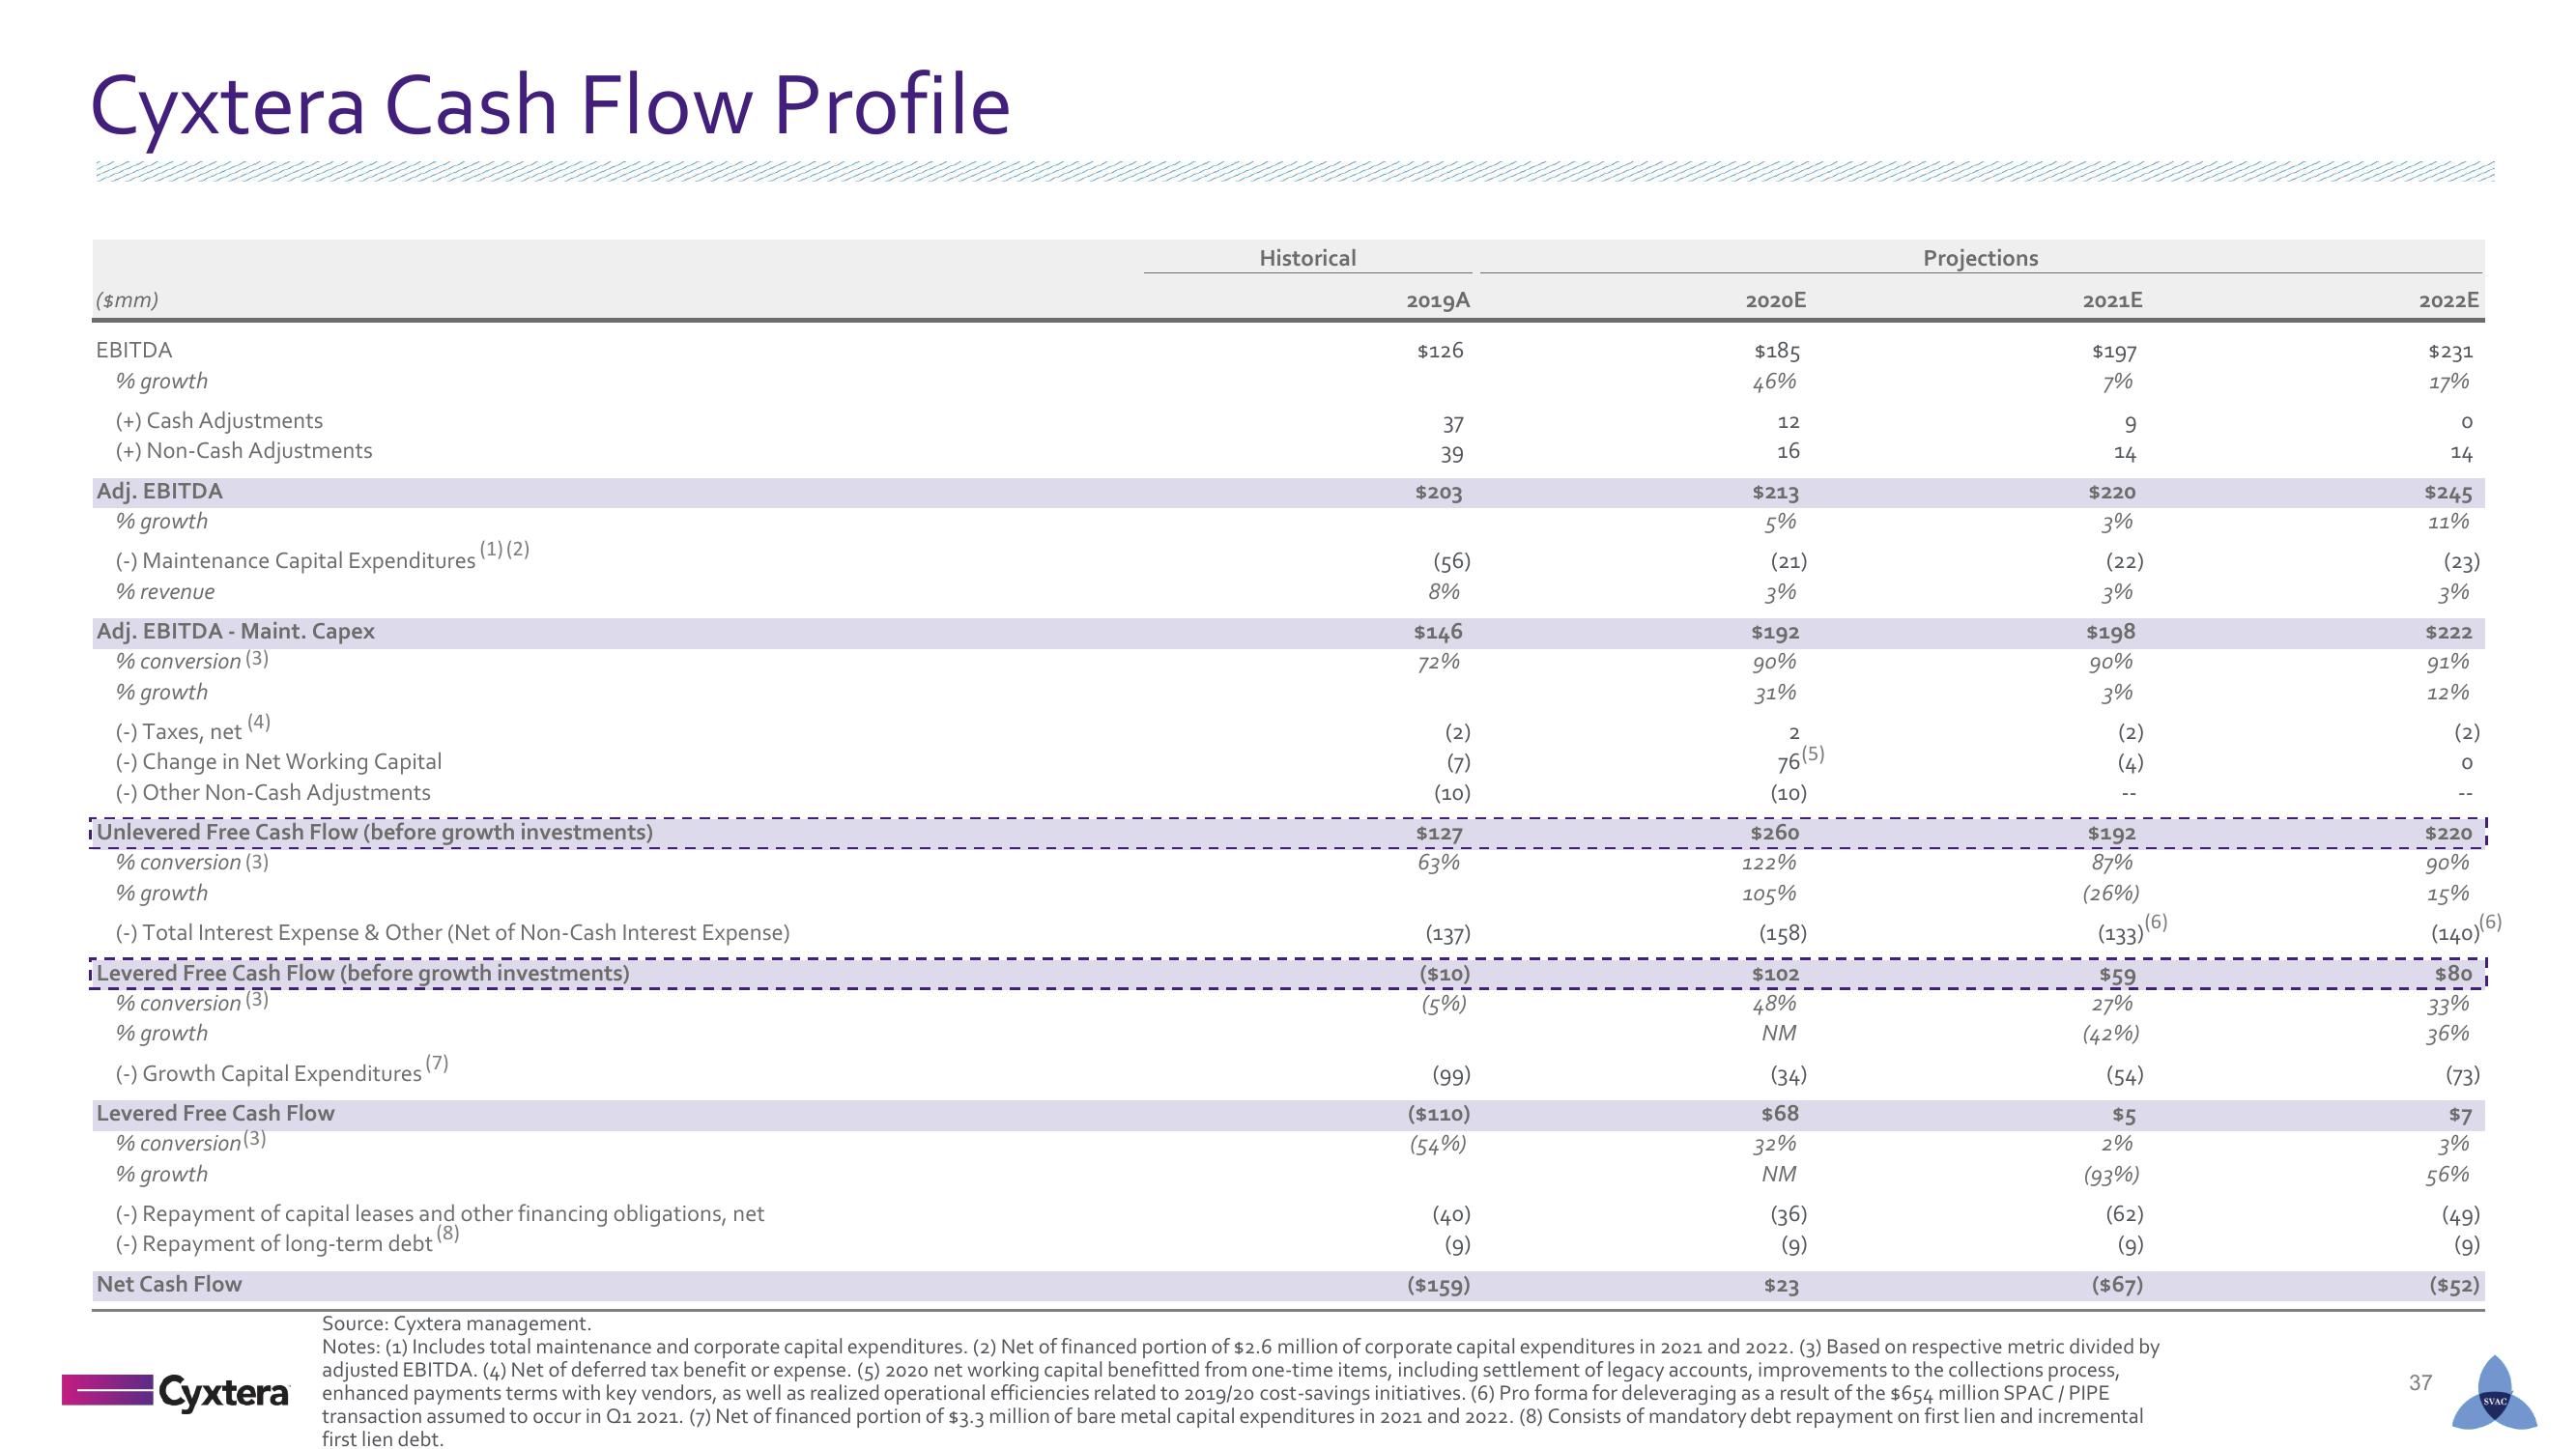
Cyxtera Cash Flow Profile
($mm)
EBITDA
% growth
(+) Cash Adjustments
(+) Non-Cash Adjustments
Adj. EBITDA
% growth
(-) Maintenance Capital Expenditures
% revenue
Adj. EBITDA - Maint. Capex
% conversion (3)
% growth
(4)
(-) Taxes, net
(-) Change in Net Working Capital
(-) Other Non-Cash Adjustments
¡Unlevered Free Cash Flow (before growth investments)
% conversion (3)
% growth
(-) Total Interest Expense & Other (Net of Non-Cash Interest Expense)
Levered Free Cash Flow (before growth investments)
% conversion (3)
% growth
(-) Growth Capital Expenditures (7)
(1) (2)
Levered Free Cash Flow
% conversion (3)
% growth
(-) Repayment of capital leases and other financing obligations, net
(-) Repayment of long-term debt
Net Cash Flow
Historical
2019A
$126
37
39
$203
(56)
8%
$146
72%
(2)
(10)
$127
63%
(137)
($10)
(5%)
(99)
($110)
(54%)
(40)
(9)
($159)
2020E
$185
46%
12
16
$213
5%
(21)
3%
$192
90%
31%
2
76(5)
(10)
$260
122%
105%
(158)
$102
48%
NM
(34)
$68
32%
NM
(36)
(9)
$23
Projections
2021E
$197
7%
9
14
$220
3%
(22)
3%
$198
90%
3%
F
$192
87%
(26%)
(6)
(133)
$59
27%
(42%)
(54)
$5
2%
(93%)
(62)
(9)
($67)
Source: Cyxtera management.
Notes: (1) Includes total maintenance and corporate capital expenditures. (2) Net of financed portion of $2.6 million of corporate capital expenditures in 2021 and 2022. (3) Based on respective metric divided by
adjusted EBITDA. (4) Net of deferred tax benefit or expense. (5) 2020 net working capital benefitted from one-time items, including settlement of legacy accounts, improvements to the collections process,
Cyxtera enhanced payments terms with key vendors, as well as realized operational efficiencies related to 2019/20 cost-savings initiatives. (6) Pro forma for deleveraging as a result of the $654 million SPAC/PIPE
transaction assumed to occur in Q1 2021. (7) Net of financed portion of $3.3 million of bare metal capital expenditures in 2021 and 2022. (8) Consists of mandatory debt repayment on first lien and incremental
first lien debt.
2022E
$231
17%
O
14
$245
11%
(23)
3%
$222
91%
12%
(2)
$220
90%
15%
(140)(6)
1
37
$80
33%
36%
(73)
$7
3%
56%
(49)
(9)
($52)
SVACView entire presentation