MoneyLion Results Presentation Deck
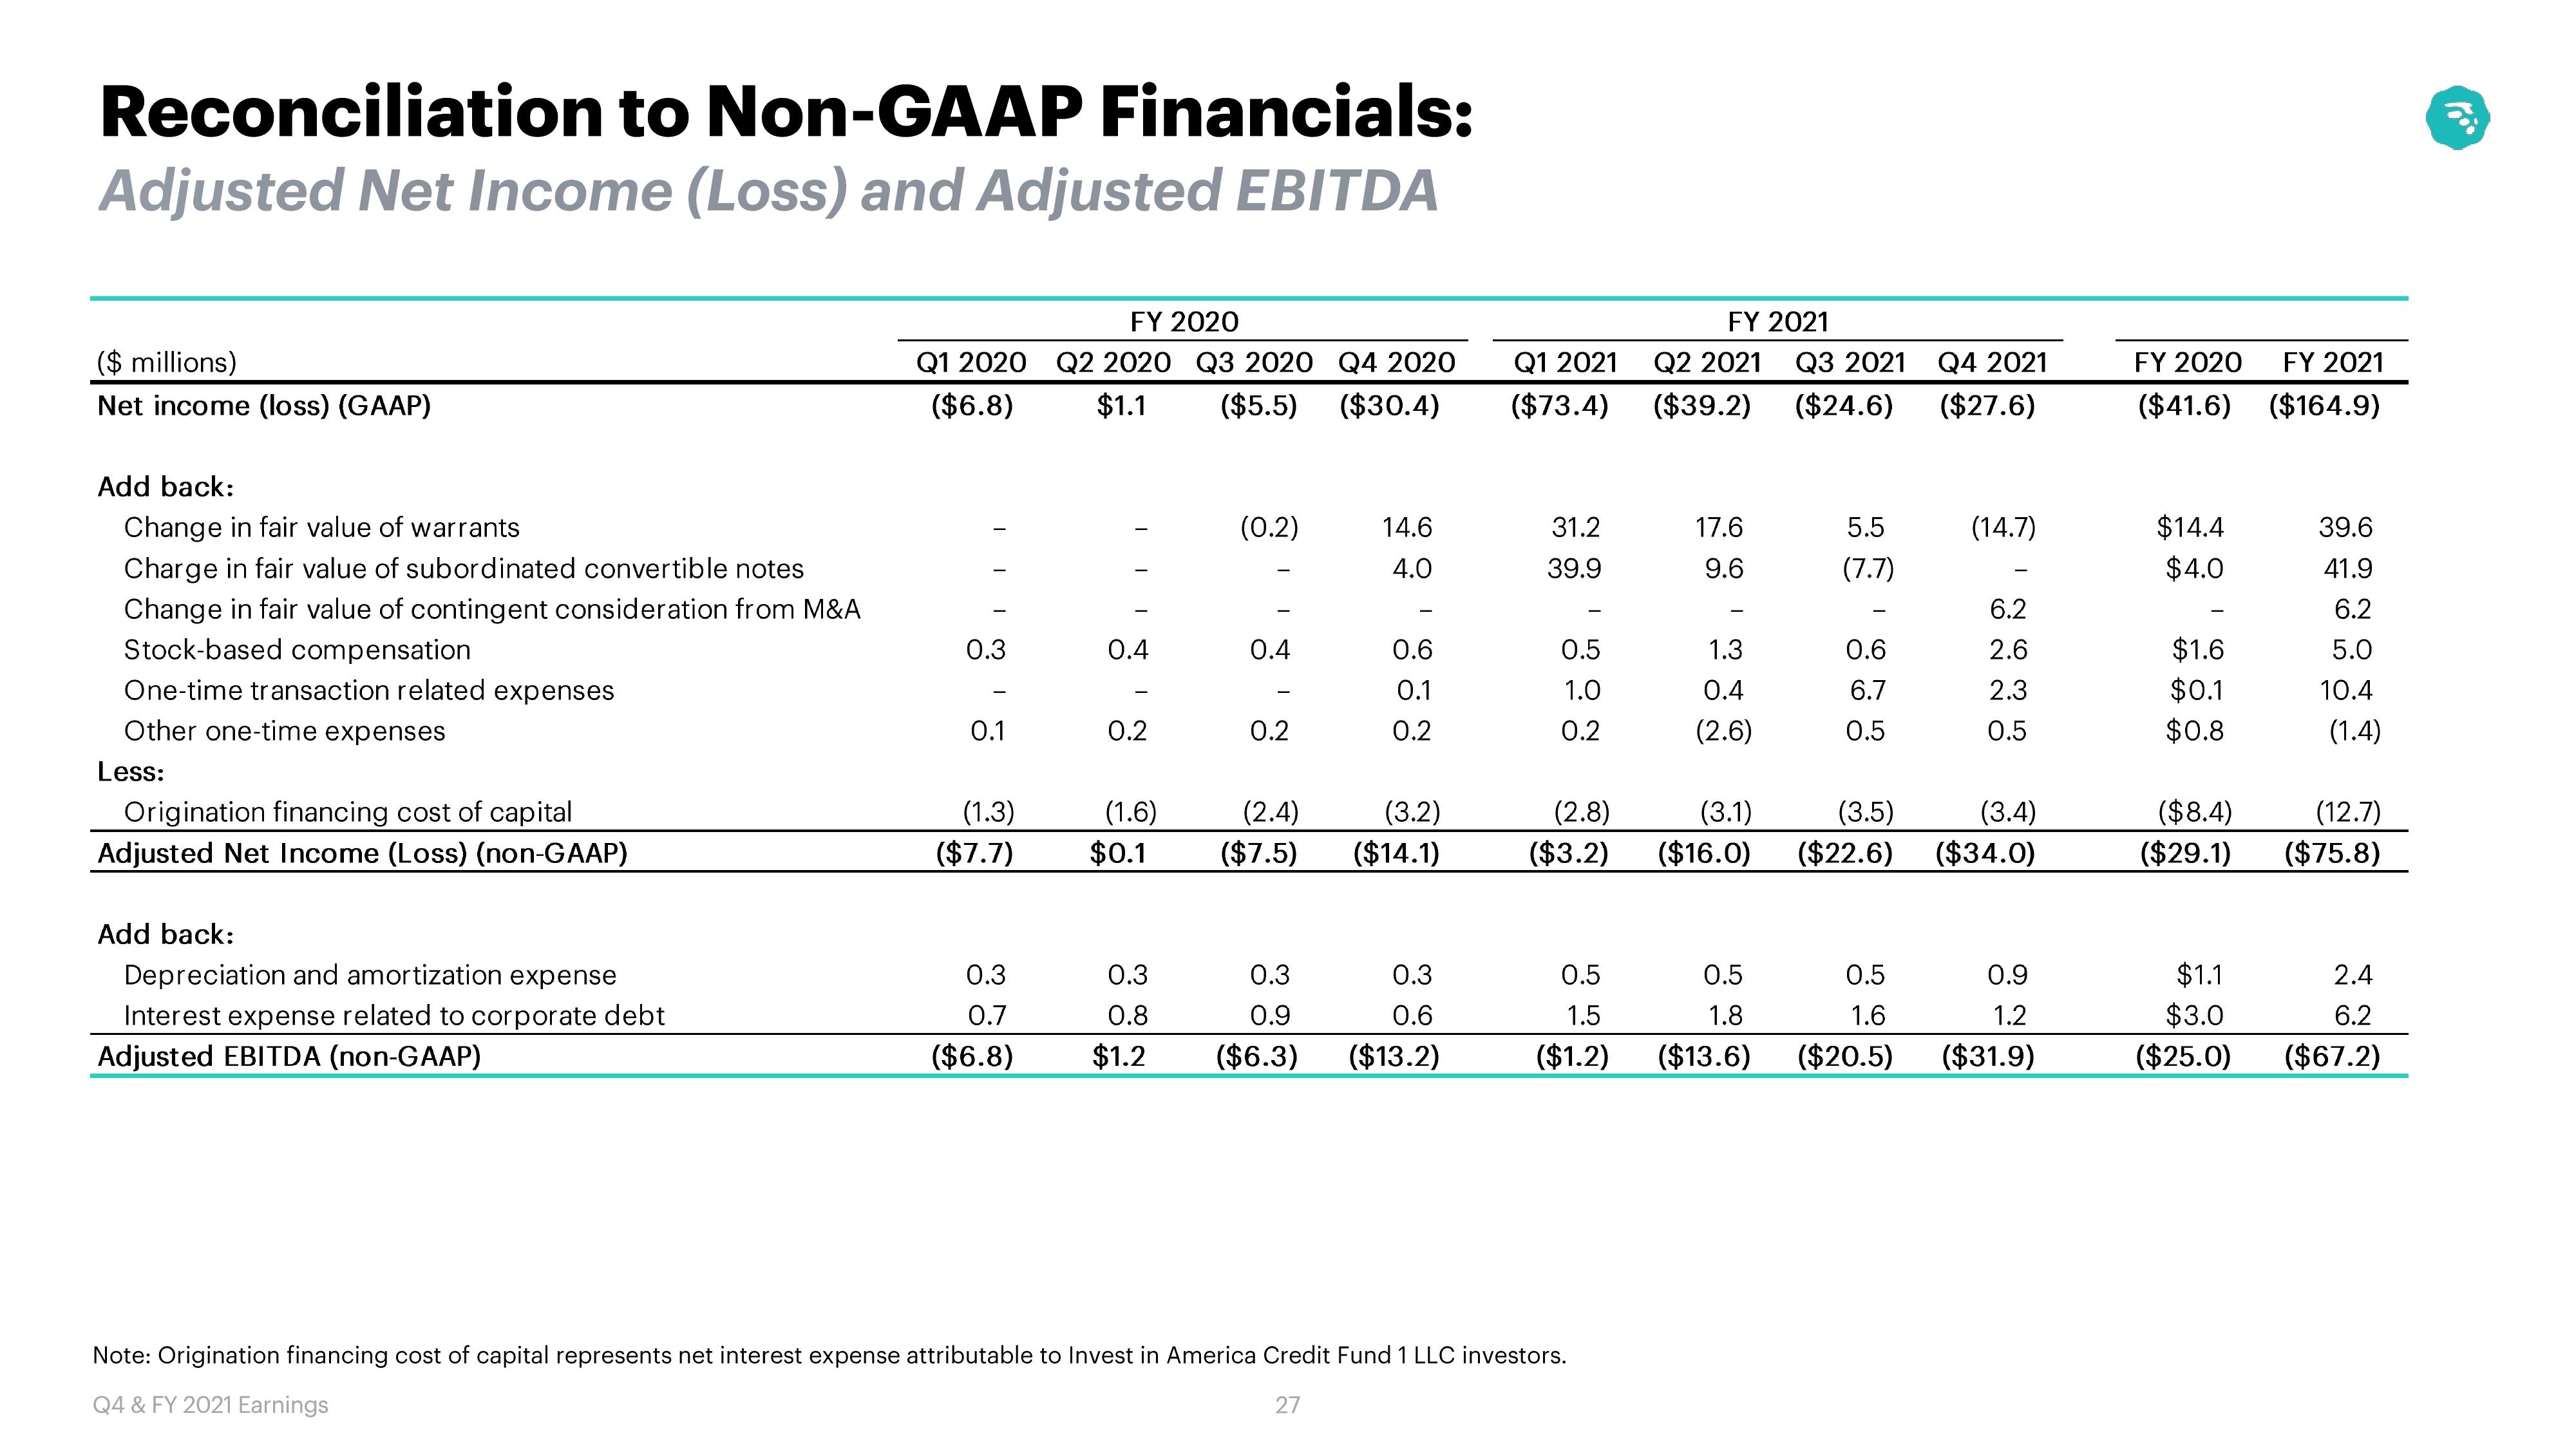
Reconciliation to Non-GAAP Financials:
Adjusted Net Income (Loss) and Adjusted EBITDA
($ millions)
Net income (loss) (GAAP)
Add back:
Change in fair value of warrants
Charge in fair value of subordinated convertible notes
Change in fair value of contingent consideration from M&A
Stock-based compensation
One-time transaction related expenses
Other one-time expenses
Less:
Origination financing cost of capital
Adjusted Net Income (Loss) (non-GAAP)
Add back:
Depreciation and amortization expense
Interest expense related to corporate debt
Adjusted EBITDA (non-GAAP)
FY 2020
Q1 2020 Q2 2020 Q3 2020 Q4 2020
($6.8) $1.1 ($5.5) ($30.4)
0.3
0.1
(1.3)
($7.7)
0.4
0.2
(0.2)
0.4
0.2
(1.6)
(2.4)
$0.1 ($7.5)
14.6
4.0
0.6
0.1
0.2
(3.2)
($14.1)
0.3
0.3
0.3
0.9
0.7
0.8
($6.8) $1.2 ($6.3) ($13.2)
0.3
0.6
Q1 2021
($73.4)
31.2
39.9
0.5
1.0
0.2
FY 2021
Q2 2021 Q3 2021
($39.2) ($24.6)
17.6
9.6
Note: Origination financing cost of capital represents net interest expense attributable to Invest in America Credit Fund 1 LLC investors.
Q4 & FY 2021 Earnings
27
1.3
0.4
(2.6)
(2.8)
(3.1)
($3.2) ($16.0)
0.5
0.5
1.5
1.8
($1.2) ($13.6)
5.5
(7.7)
0.6
6.7
0.5
(3.5)
($22.6)
0.5
1.6
($20.5)
Q4 2021
($27.6)
(14.7)
6.2
2.6
2.3
0.5
(3.4)
($34.0)
0.9
1.2
($31.9)
FY 2020
($41.6)
$14.4
$4.0
$1.6
$0.1
$0.8
($8.4)
($29.1)
$1.1
$3.0
($25.0)
FY 2021
($164.9)
39.6
41.9
6.2
5.0
10.4
(1.4)
(12.7)
($75.8)
2.4
6.2
($67.2)View entire presentation