First Busey Results Presentation Deck
2Q23 Earnings Investor Presentation
First Busey Corporation | Ticker: BUSE
Diversified and Significant Sources of Fee Income
■
■
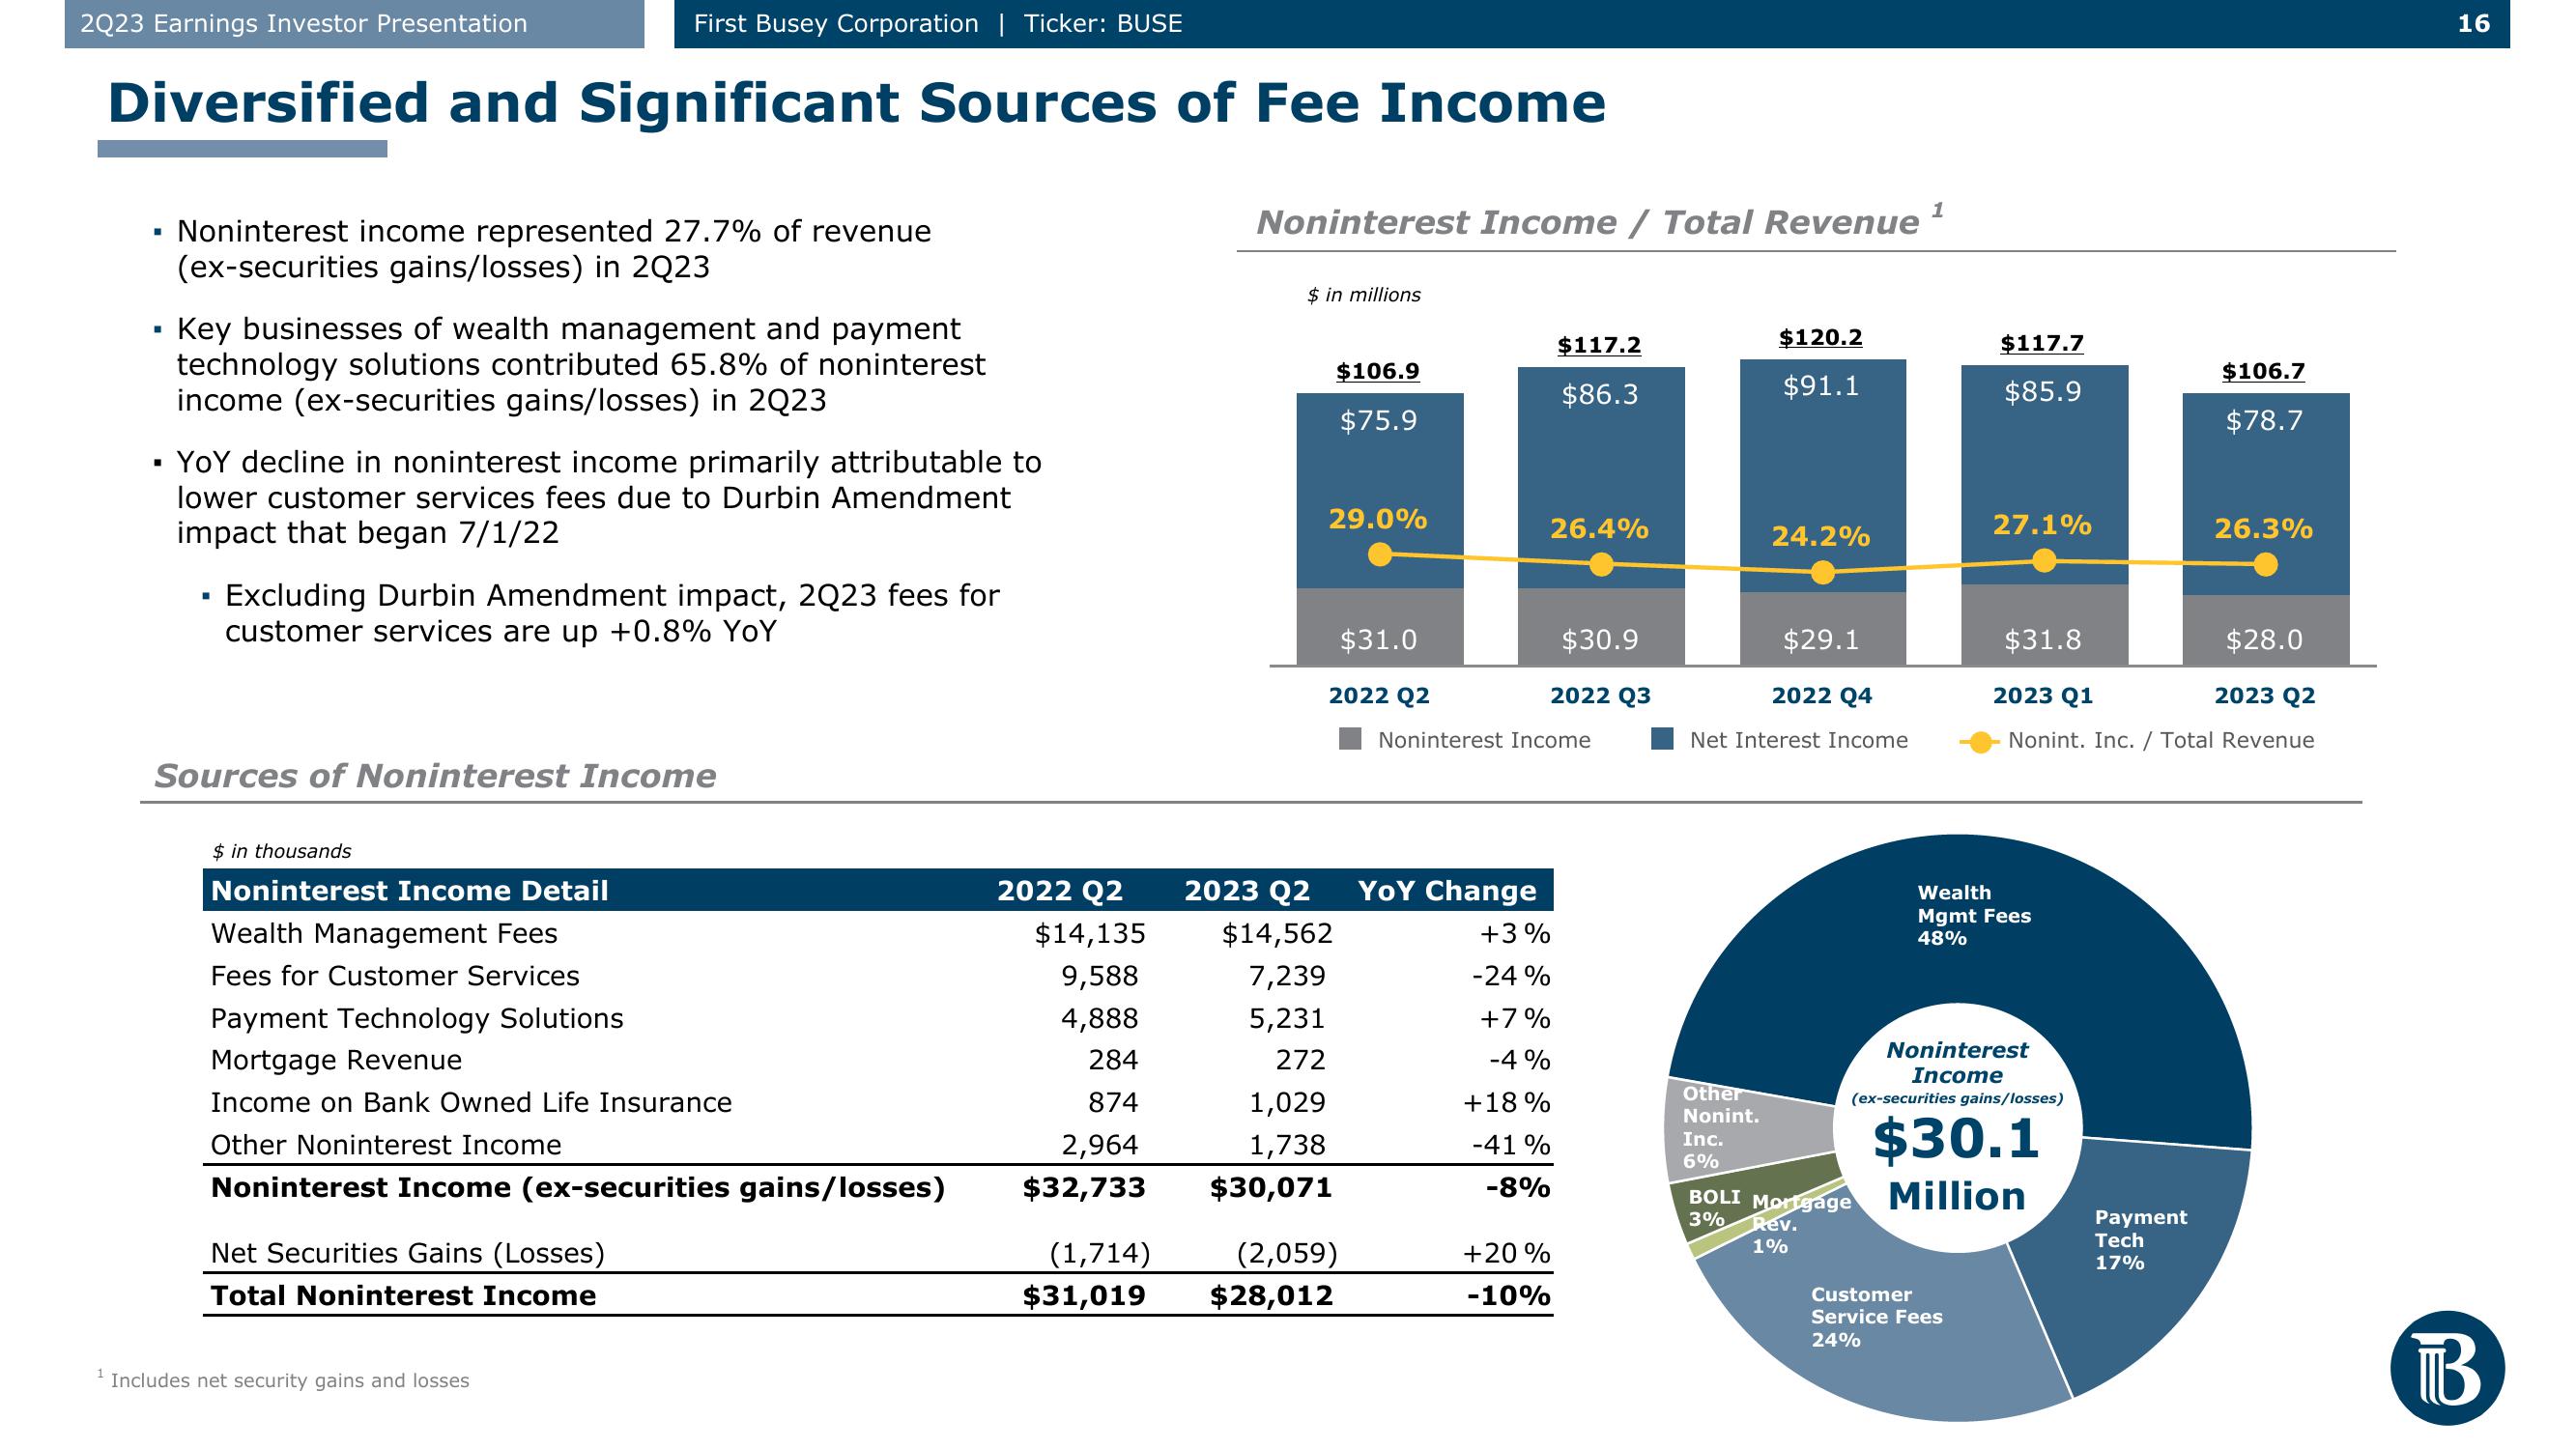
Noninterest income represented 27.7% of revenue
(ex-securities gains/losses) in 2Q23
Key businesses of wealth management and payment
technology solutions contributed 65.8% of noninterest
income (ex-securities gains/losses) in 2Q23
YOY decline in noninterest income primarily attributable to
lower customer services fees due to Durbin Amendment
impact that began 7/1/22
I
Excluding Durbin Amendment impact, 2Q23 fees for
customer services are up +0.8% YoY
Sources of Noninterest Income
$ in thousands
Noninterest Income Detail
Wealth Management Fees
Fees for Customer Services
Payment Technology Solutions
Mortgage Revenue
Income on Bank Owned Life Insurance
Other Noninterest Income
Noninterest Income (ex-securities gains/losses)
Net Securities Gains (Losses)
Total Noninterest Income
Includes net security gains and losses
2022 Q2
$14,135
9,588
4,888
284
874
2,964
$32,733
(1,714)
$31,019
1
Noninterest Income / Total Revenue ¹
$ in millions
2023 Q2
29.0%
$106.9
$75.9
$14,562
7,239
5,231
272
2022 Q2
1,029
1,738
$30,071
$31.0
(2,059)
$28,012
YOY Change
+3%
-24%
+7%
-4%
+18 %
-41%
-8%
$117.2
$86.3
+20%
-10%
26.4%
$30.9
Noninterest Income
2022 Q3
Other
Nonint.
$120.2
$91.1
24.2%
2022 Q4
Net Interest Income
Inc.
6%
$29.1
$117.7
$85.9
27.1%
$31.8
Wealth
Mgmt Fees
48%
Customer
Service Fees
24%
$28.0
2023 Q2
2023 Q1
Nonint. Inc. / Total Revenue
Noninterest
Income
(ex-securities gains/losses)
$30.1
BOLI Mortgage Million
3% Rev.
1%
$106.7
$78.7
Payment
Tech
17%
26.3%
16
BView entire presentation