Bank of America Investment Banking Pitch Book
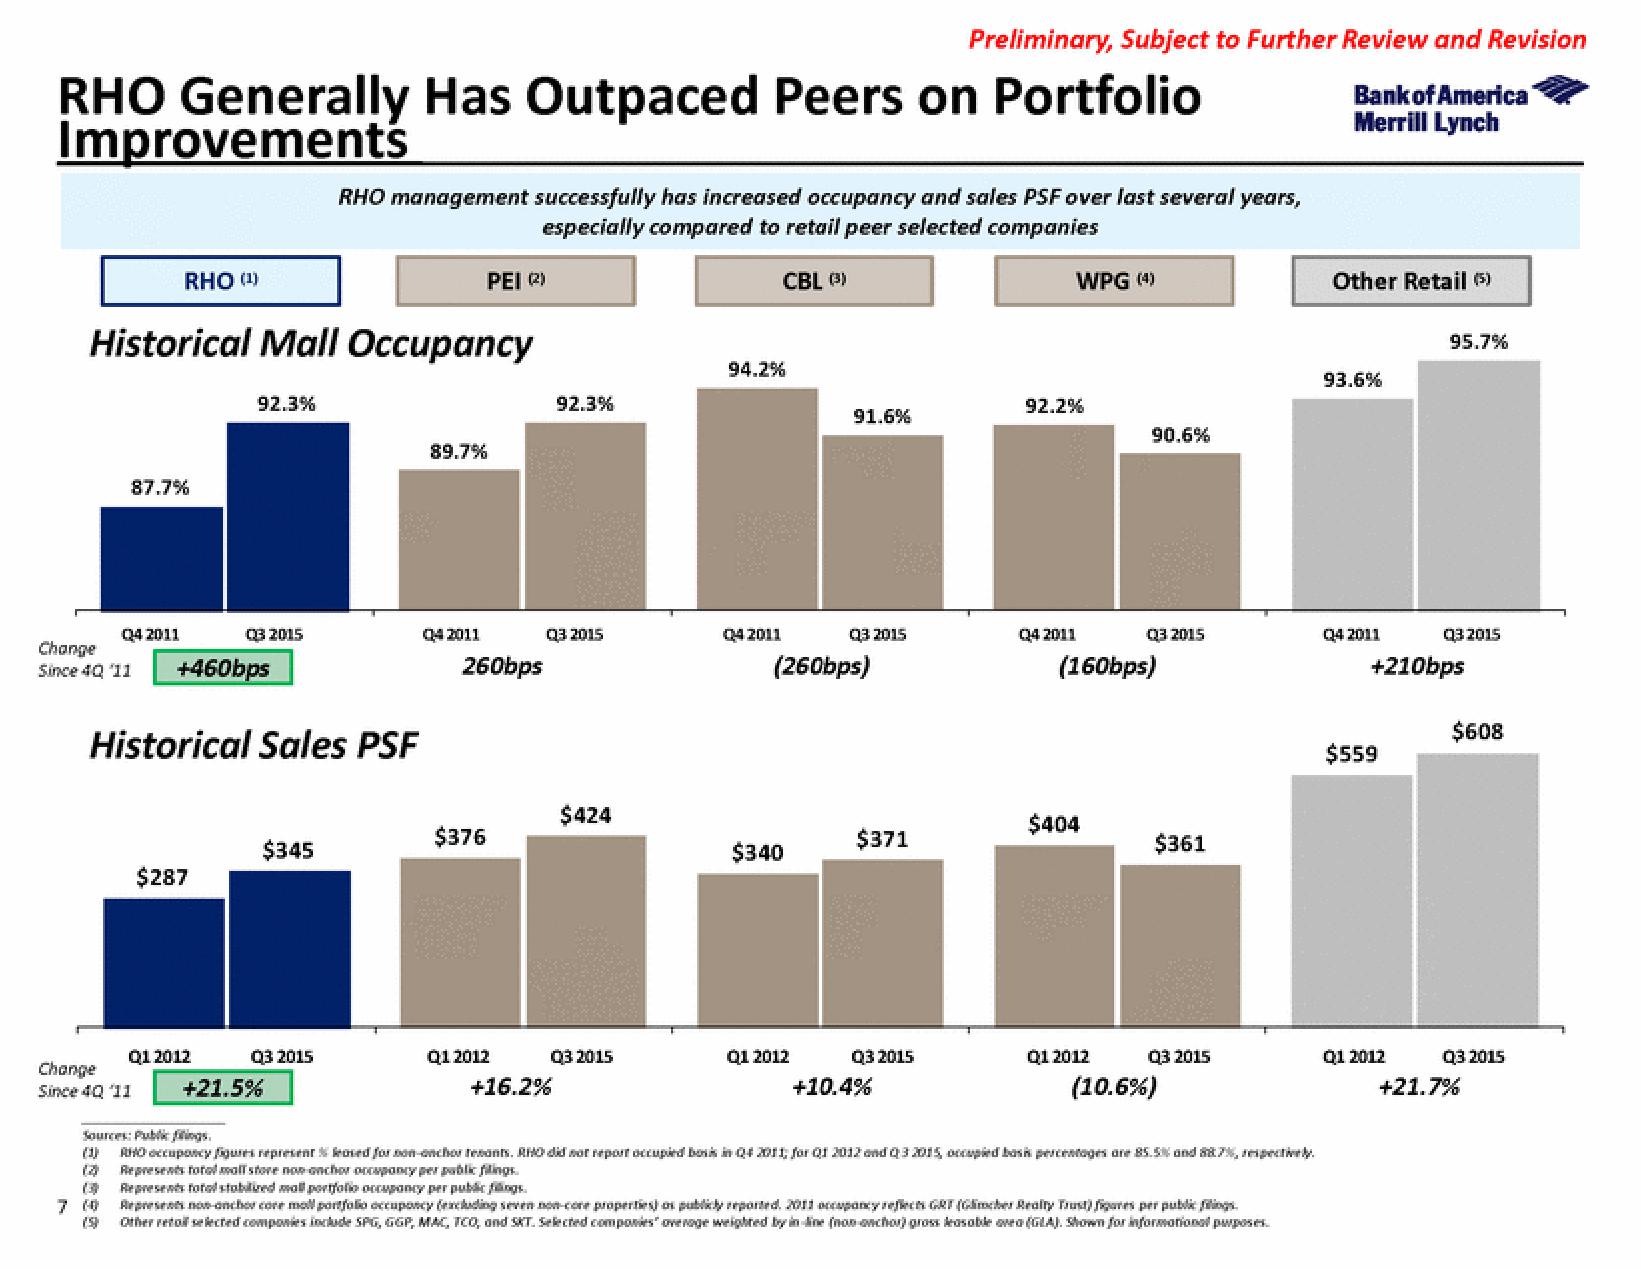
RHO Generally Has Outpaced Peers on Portfolio
Improvements
RHO (¹)
Historical Mall Occupancy
87.7%
Q4 2011
Change
Since 4Q 11 +460bps
Change
Since 40 '11
13
(3
7 (0
19
92.3%
Historical Sales PSF
$287
Q1 2012
03 2015
$345
Q3 2015
+21.5%
RHO management successfully has increased occupancy and sales PSF over last several years,
especially compared to retail peer selected companies
CBL (3)
89.7%
04 2011
PEI (2²)
260bps
$376
Q1 2012
92.3%
Q3 2015
+16.2%
$424
03 2015
94.2%
Q4 2011
$340
91.6%
(260bps)
Q1 2012
Q3 2015
Preliminary, Subject to Further Review and Revision
Bank of America
Merrill Lynch
$371
Q3 2015
+10.4%
WPG (4)
92.2%
Q4 2011
$404
90.6%
(160bps)
Q1 2012
03 2015
$361
Q3 2015
(10.6%)
Sources: Public filings.
RHO occupancy figures represent & leased for non-onchor resants. RHO did not report occupied bok in Q4 2011, for Q1 2012 and 03 2015, occupied bash percentages are 85.5% and 887%, respectively.
Represents tot mall store non anchor occupancy per public filings
Represents total stabilired mall portfolio occupancy per public figs.
Represents non-onchor core moll portfolio occupancy (excluding seven non-core properties) os publicly reported. 2011 occupancy reflects GRT (Glimcher Realty Trust) figures per public filings.
Other retol selected companies include SPG, GGP, MAC, TCO, and SAT. Selected companies" overage weighted by in line (non anchor) gross leasable oveo (GLA). Shown for informational purposes.
Other Retail (5)
93.6%
Q4 2011
$559
95.7%
+210bps
Q1 2012
Q3 2015
$608
Q3 2015
+21.7%View entire presentation