Credit Suisse Investment Banking Pitch Book
CONFIDENTIAL
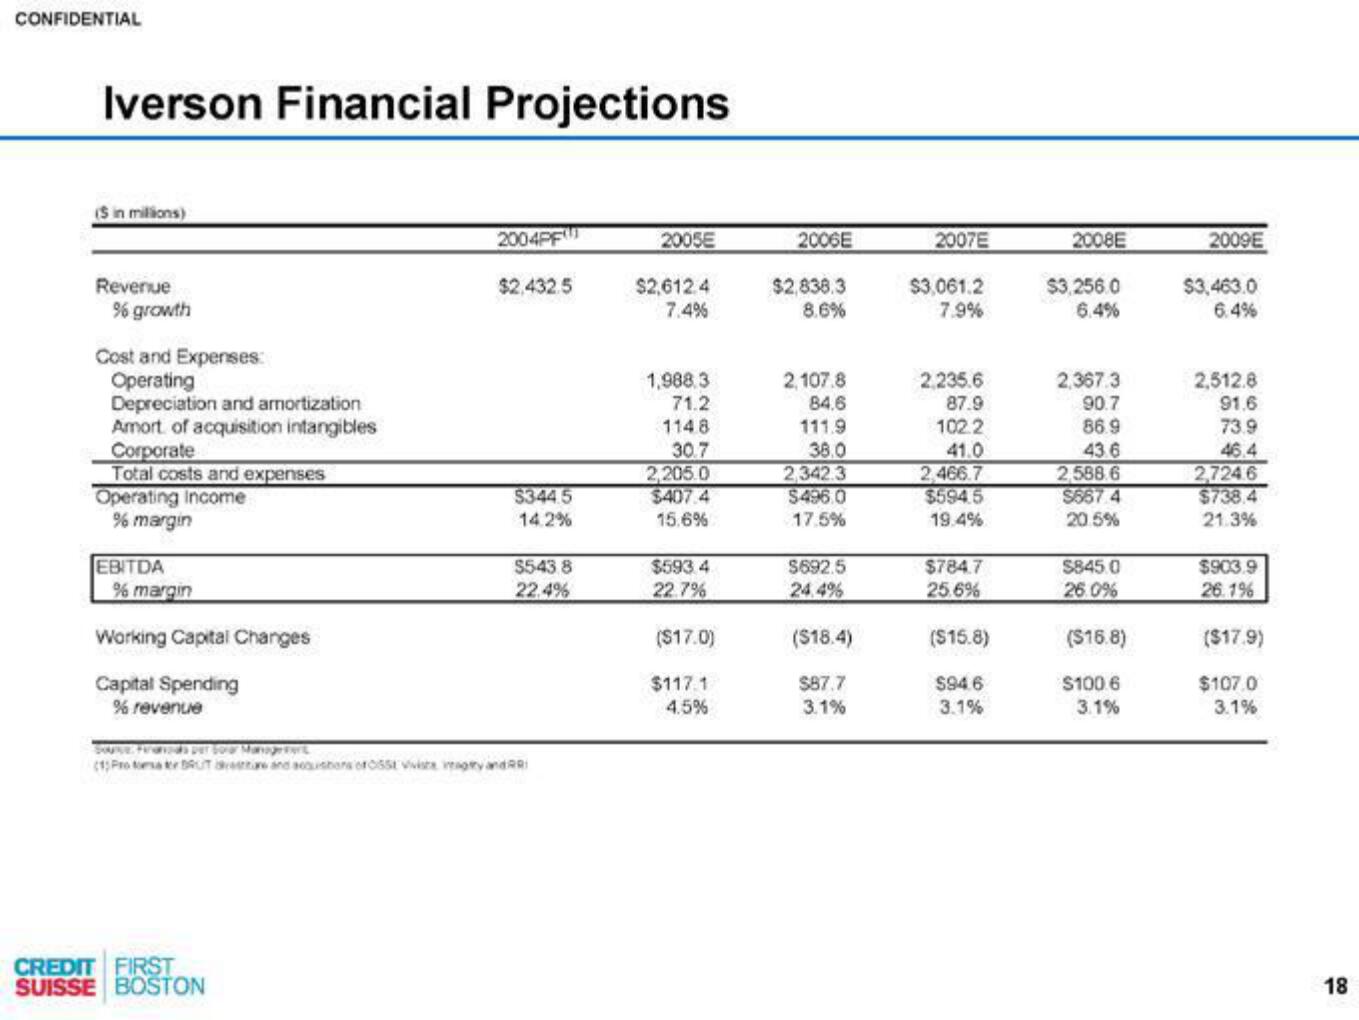
Iverson Financial Projections
($ in millions)
Revenue
% growth
Cost and Expenses:
Operating
Depreciation and amortization
Amort of acquisition intangibles
Corporate
Total costs and expenses
Operating Income
% margin
EBITDA
% margin
Working Capital Changes
Capital Spending
% revenue
Sve Ferands per or Manager
(1) Proto DRUT
CREDIT FIRST
SUISSE BOSTON
2004PF
$2.432.5
$344.5
14.2%
$543 8
22.4%
are and acoustons ofO551 viviste imagy and Ri
2005E
$2,612.4
7.4%
1,988.3
71.2
1148
30.7
2,205.0
$407.4
15.6%
$593 4
22.7%
($17.0)
$117.1
4.5%
2006E
$2,838.3
8.6%
2,107.8
84.6
111.9
38.0
2,342.3
$496.0
17.5%
$692.5
24,4%
($18.4)
$87.7
3.1%
2007E
$3,061.2
7.9%
2,235.6
87.9
102.2
41.0
2,466.7
$594.5
19.4%
$784.7
25.6%
($15.8)
$94.6
3.1%
2008E
$3,256.0
6.4%
2,367.3
90.7
86.9
43.6
2,588.6
$667 4
20.5%
$845.0
26.0%
($16.8)
$100.6
3.1%
2009E
$3,463.0
6.4%
2,512.8
91.6
73.9
46.4
2,724.6
$738.4
21.3%
$903.9
26.1%
($17.9)
$107.0
3.1%
18View entire presentation