Cyxtera SPAC Presentation Deck
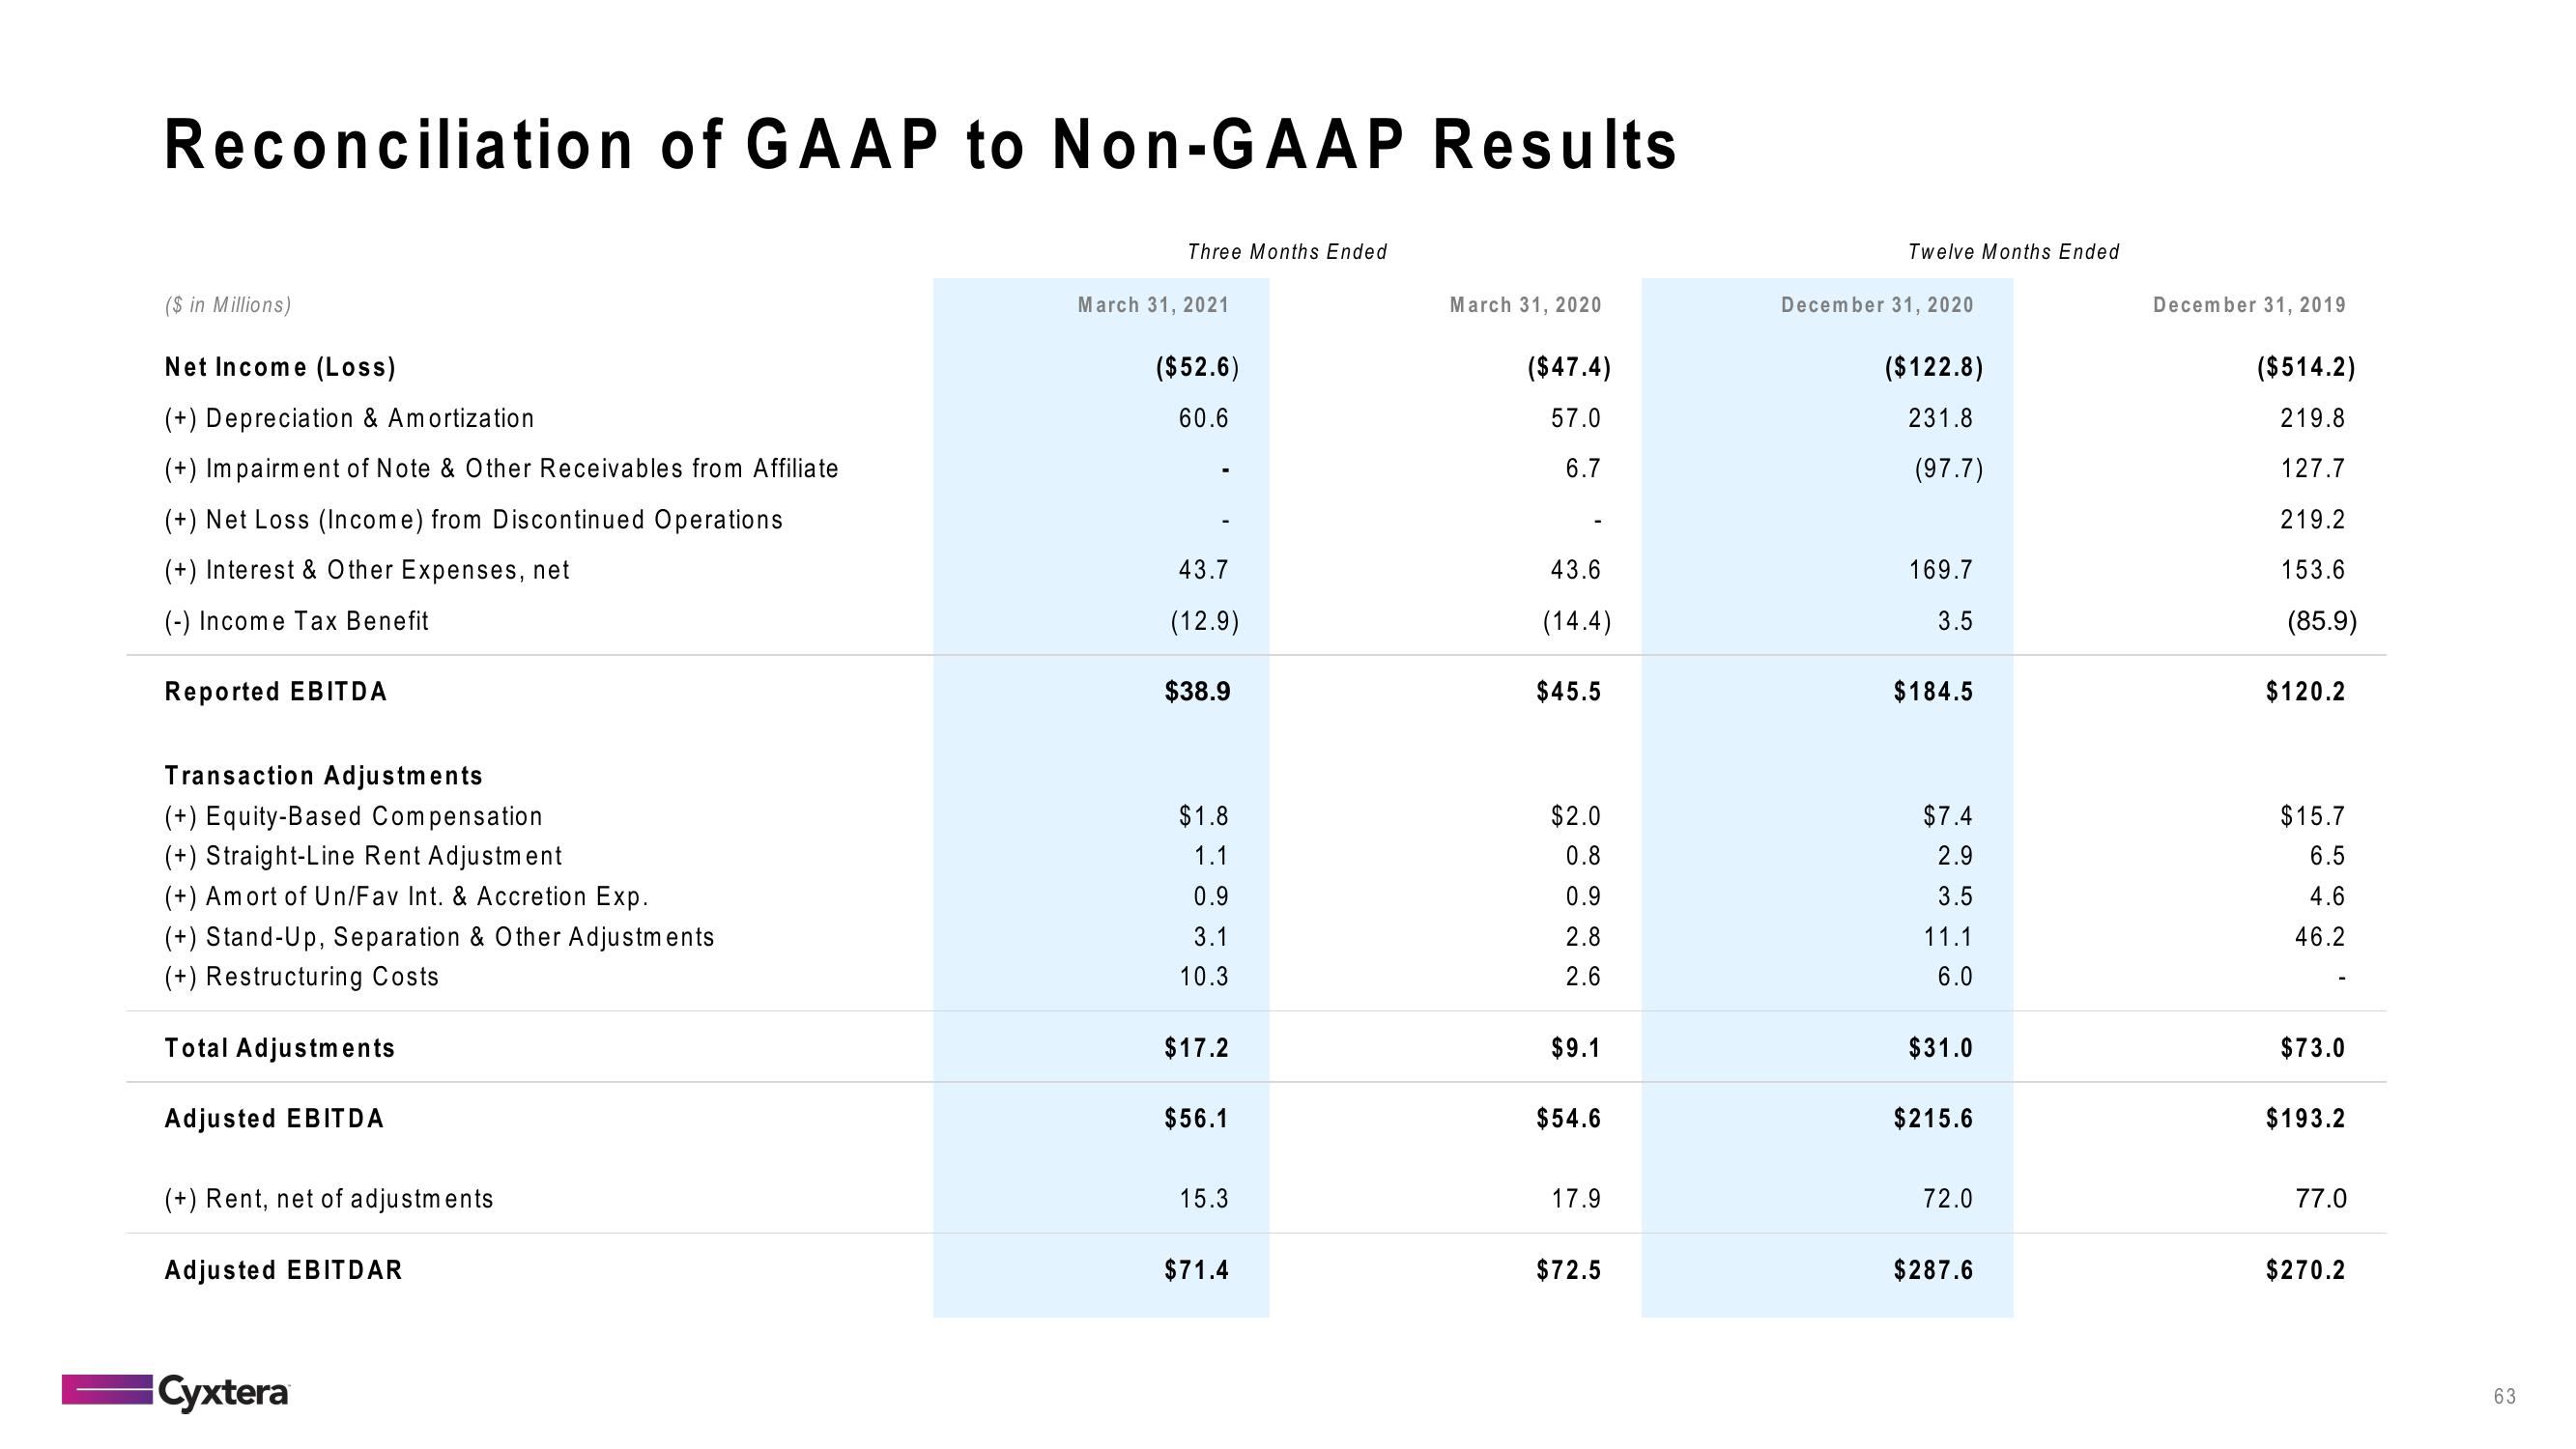
Reconciliation of GAAP to Non-GAAP Results
($ in Millions)
Net Income (Loss)
(+) Depreciation & Amortization
(+) Impairment of Note & Other Receivables from Affiliate
(+) Net Loss (Income) from Discontinued Operations
(+) Interest & Other Expenses, net
(-) Income Tax Benefit
Reported EBITDA
Transaction Adjustments
(+) Equity-Based Compensation
(+) Straight-Line Rent Adjustment
(+) Amort of Un/Fav Int. & Accretion Exp.
(+) Stand-Up, Separation & Other Adjustments
(+) Restructuring Costs
Total Adjustments
Adjusted EBITDA
(+) Rent, net of adjustments
Adjusted EBITDAR
Cyxtera
Three Months Ended
March 31, 2021
($52.6)
60.6
43.7
(12.9)
$38.9
$1.8
1.1
0.9
3.1
10.3
$17.2
$56.1
15.3
$71.4
March 31, 2020
($47.4)
57.0
6.7
43.6
(14.4)
$45.5
$2.0
0.8
0.9
2.8
2.6
$9.1
$54.6
17.9
$72.5
Twelve Months Ended
December 31, 2020
($122.8)
231.8
(97.7)
169.7
3.5
$184.5
$7.4
2.9
3.5
11.1
6.0
$31.0
$215.6
72.0
$287.6
December 31, 2019
($514.2)
219.8
127.7
219.2
153.6
(85.9)
$120.2
$15.7
6.5
4.6
46.2
$73.0
$193.2
77.0
$270.2
63View entire presentation