Baird Investment Banking Pitch Book
AR KEY PERFORMANCE DRIVERS (CONT.)
1
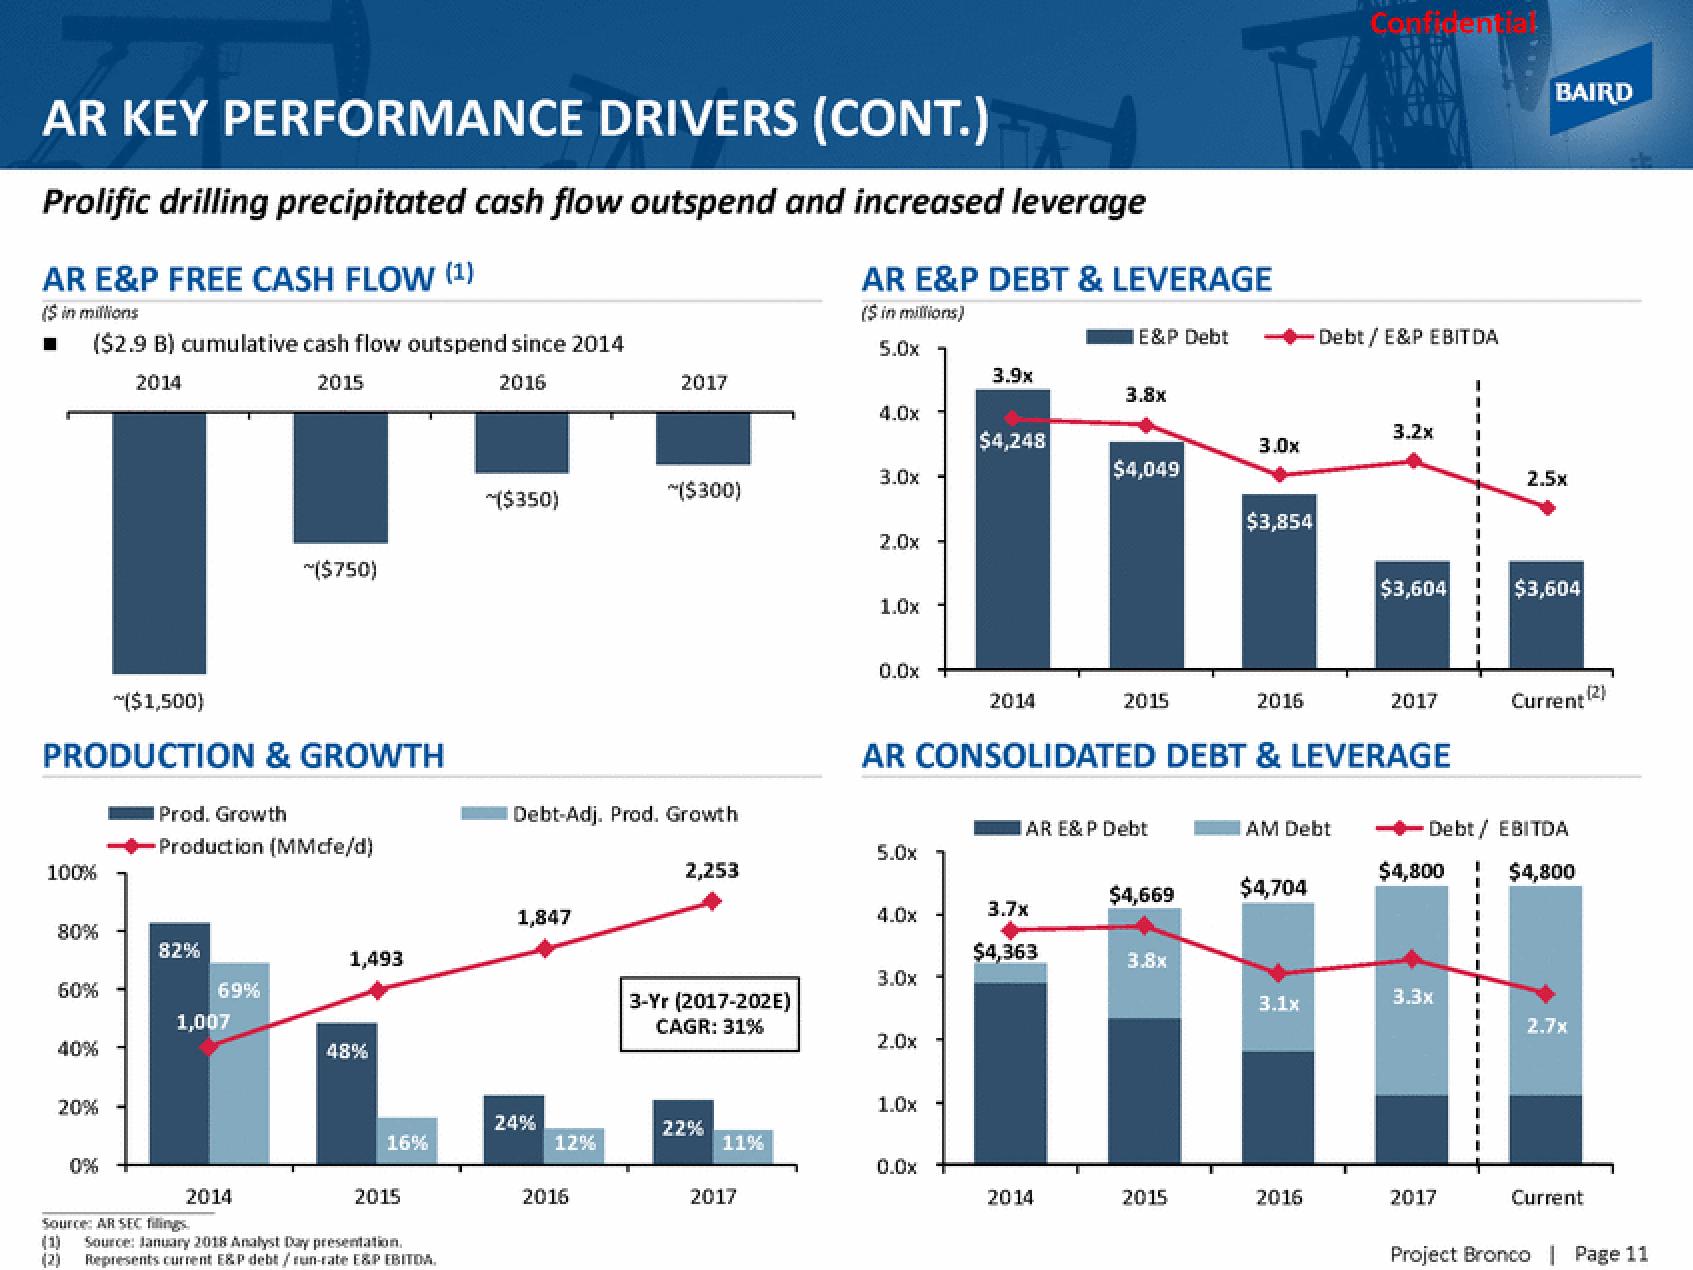
Prolific drilling precipitated cash flow outspend and increased leverage
AR E&P FREE CASH FLOW (1)
($ in millions
($2.9 B) cumulative cash flow outspend since 2014
2014
2015
2016
($1,500)
PRODUCTION & GROWTH
100%
80%
60%
40%
20%
(2)
Prod. Growth
Production (MMcfe/d)
82%
69%
1,007
Source: AR SEC filings
~($750)
2014
1,493
48%
16%
2015
Source: January 2018 Analyst Day presentation.
Represents current E&P debt/run-rate E&P EBITDA.
~($350)
1,847
Debt-Adj. Prod. Growth
24%
12%
2017
2016
*($300)
2,253
3-Yr (2017-202E)
CAGR: 31%
22%
11%
2017
AR E&P DEBT & LEVERAGE
($ in millions)
5.0x
4.0x
3.0x
2.0x
1.0x
0.0x
5.0x
4.0x
3.0x
2.0x
1.0x
3.9x
0.0x
$4,248
2014
E&P Debt
3.7x
$4,363
3.8x
2014
$4,049
2015
IAR E&P Debt
AR CONSOLIDATED DEBT & LEVERAGE
$4,669
3.8x
3.0x
2015
$3,854
2016
AM Debt
$4,704
3.1x
Confidential
Debt / E&P EBITDA
2016
3.2x
$3,604
2017
$4,800
3.3x
2017
BAIRD
Debt / EBITDA
$4,800
I
2.5x
$3,604
Current (2)
2.7x
Current
Project Bronco | Page 11View entire presentation